Density Quality Analysis
Point cloud density quality inspection is an important method for evaluating the quality of point cloud data collection and processing effects. It is widely used in surveying, modeling, quality control and other scenarios. By analyzing the point cloud density distribution, it can effectively identify quality issues such as data missing and acquisition blind spots, providing scientific basis for subsequent data processing and engineering decision-making.
Function Description: Based on point cloud files, generate corresponding density distribution maps and compile statistical information into a density report.
Parameters
Level: Defined by low value (minimum points), high value (maximum points), and color. Used to set density level display colors.
Grid Size: The physical size corresponding to a single pixel in the output density map. Larger grid results in lower resolution, while smaller grid results in higher resolution.
More Settings: Used for additional personalized settings of the density report. Includes report name, project name, company, author, and custom logo.
Output Path: Output path for the density report file.
Steps
- Click the Density Quality Analysis button, and the interface will appear as follows:
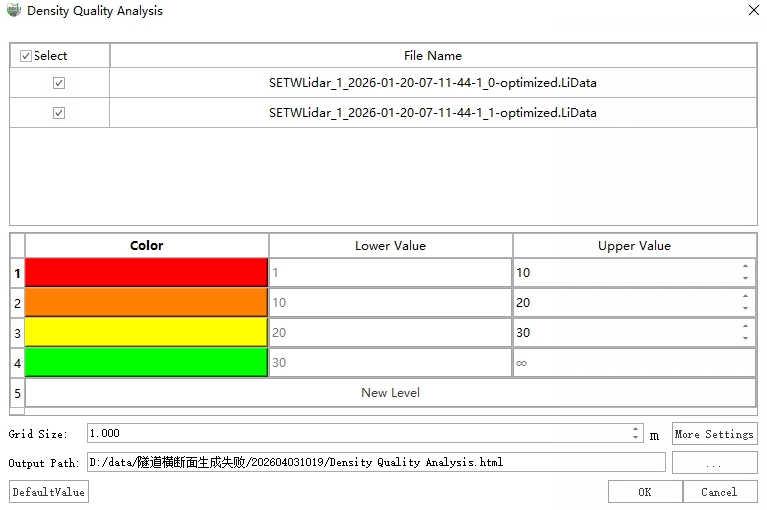
- Set parameters and output path, click OK to output the report.
Report Content
Project Table: By default outputs two parameters: number of point cloud files and grid size. If More Settings is set, it will be displayed in this table.
Density Quality Analysis Table: For each point cloud file, statistics include: file name, minimum density point, maximum density point, average density, point count, and coverage area.
Density Images: For each point cloud file, generates a density distribution images.