Point Cloud Layer
Parameter Settings:
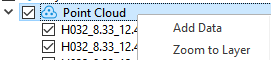
- Add Data: Add point cloud data files, multiple selections are supported.
- Remove All: Remove all point cloud data under the current node.
- Zoom to Layer: Calculate the bounding box of all current point cloud data and display globally within this bounding box range in all windows that open this data.
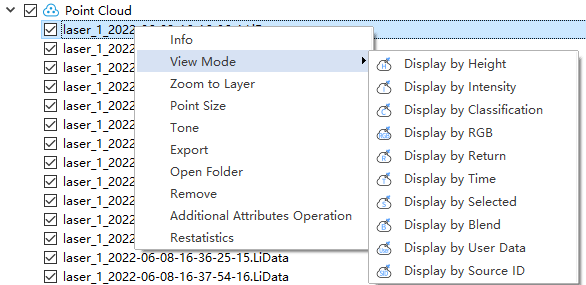
Right-Click Menu
Point Cloud Right-click menu includes the following options:
Note: A is a counterclockwise rotation point cloud, G is a clockwise rotation point cloud.
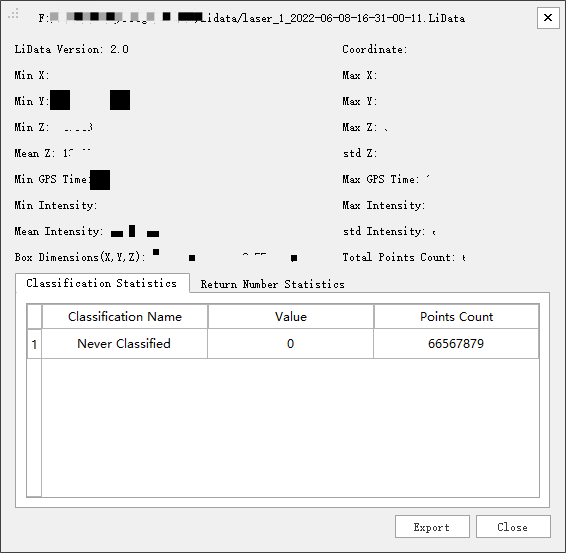
1.Info: Display basic information about the point cloud, including the data path, Coordinate, minimum and maximum values of X, Y, and Z, the mean and std deviation of Z, minimum and maximum GPS time, minimum and maximum values, the mean and std deviation of intensity, Box Dimensions, Total Points Count, Classification Statistics and Return Number Statistics. Clicking the "Export" button allows you to export the basic information of the point cloud as a txt file.
Parameter Settings:
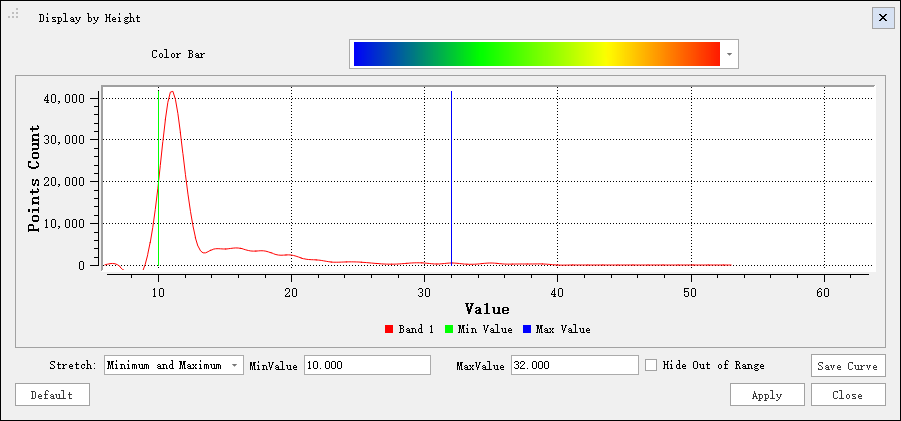
- Color Bar: A Color Bar used to map point cloud the attribute of height.
- Display Histogram: Display the histogram as needed.
- Stretch: Set the stretch mode of the histogram: Min, Max and Std deviation.
- Minimum and Maximum Values (Default): Linear stretch based on minimum and maximum pixel values, with minimum and maximum pixel values as endpoints of the histogram. For example, if the minimum and maximum values of the image are 2488 and 2656 respectively, linear stretch distributes pixel values between 0-255, increasing image brightness and contrast by distributing pixel values across the entire histogram range, making elements in the image easy to distinguish.
- Standard Deviation: The Std deviation stretch type applies for linear extension between values defined by standard deviation n. For example, if the minimum and maximum values of the image are 2488 and 2656 respectively and n is 2, values exceeding ±2 times the standard deviation will become 0 or 255, and other values are stretched between 0-255.
- Hide out-of-range data: Point cloud data with corresponding values less than the minimum value and greater than the maximum value is not displayed.
For the specific display effect, refer to Display by Height.
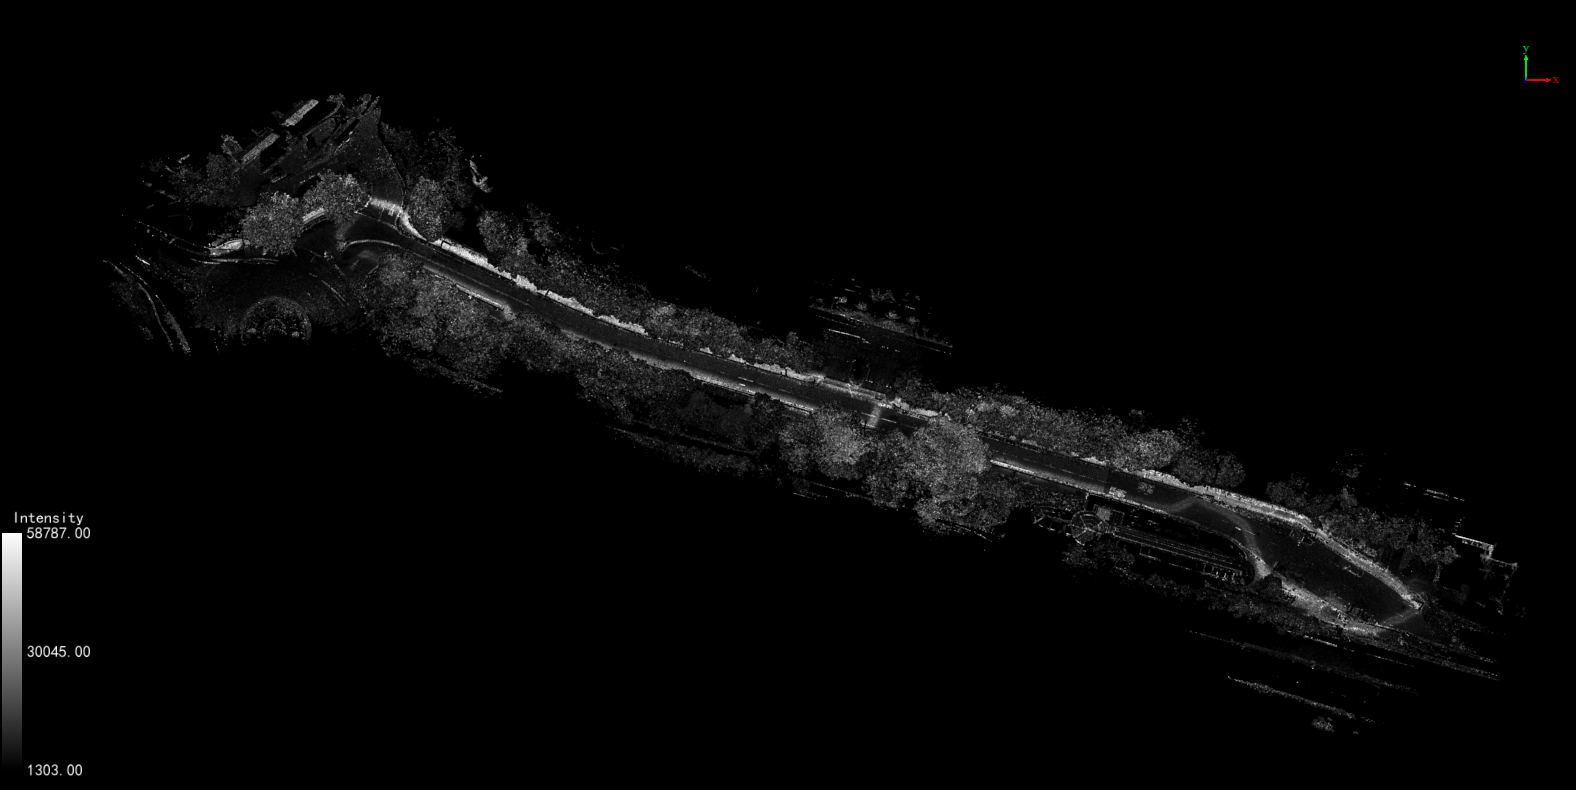
(2)Display by Intensity: Linked with point cloud color mode function. Display by Intensity can be used for the display of point cloud data, mapping the Intensity of point cloud data to evenly changing color intervals, more intuitively showing the change of point cloud data intensity values.
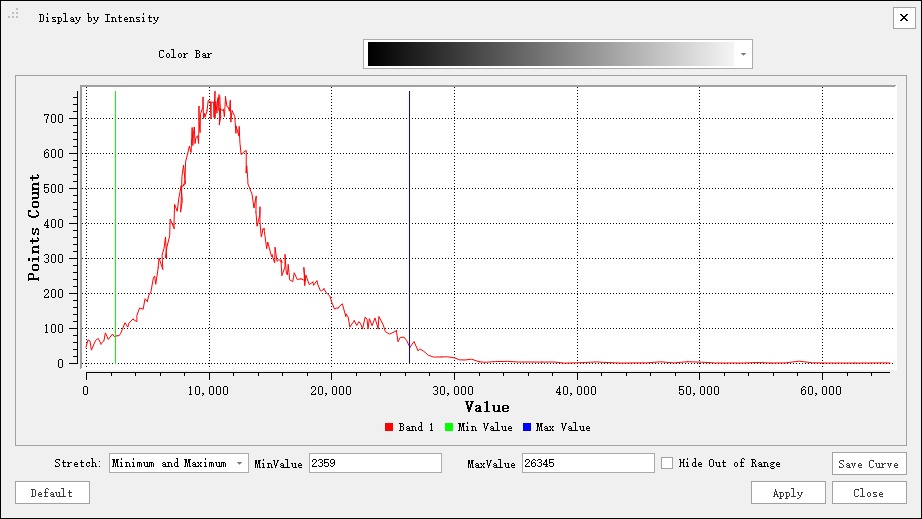
Parameter Settings:
- Color Bar: A Color Bar used to map point cloud the attribute of height.
- Display Histogram: Display the histogram as needed.
- Stretch: Set the stretch mode of the histogram: Min, Max and Std deviation.
- Minimum and Maximum Values (Default): Linear stretch based on minimum and maximum pixel values, with minimum and maximum pixel values as endpoints of the histogram. For example, if the minimum and maximum values of the image are 2488 and 2656 respectively, linear stretch distributes pixel values between 0-255, increasing image brightness and contrast by distributing pixel values across the entire histogram range, making elements in the image easy to distinguish.
- Standard Deviation: The Std deviation stretch type applies for linear extension between values defined by standard deviation n. For example, if the minimum and maximum values of the image are 2488 and 2656 respectively and n is 2, values exceeding ±2 times the standard deviation will become 0 or 255, and other values are stretched between 0-255.
- Hide out-of-range data: Point cloud data with corresponding values less than the minimum value and greater than the maximum value is not displayed.
For the specific display effect, refer to Display by Intensity.
(3)Display by Classification: Please refer to Display by Classification for specific display effects.
(4)Display by RGB: Please refer to Display by RGB for specific display effects.
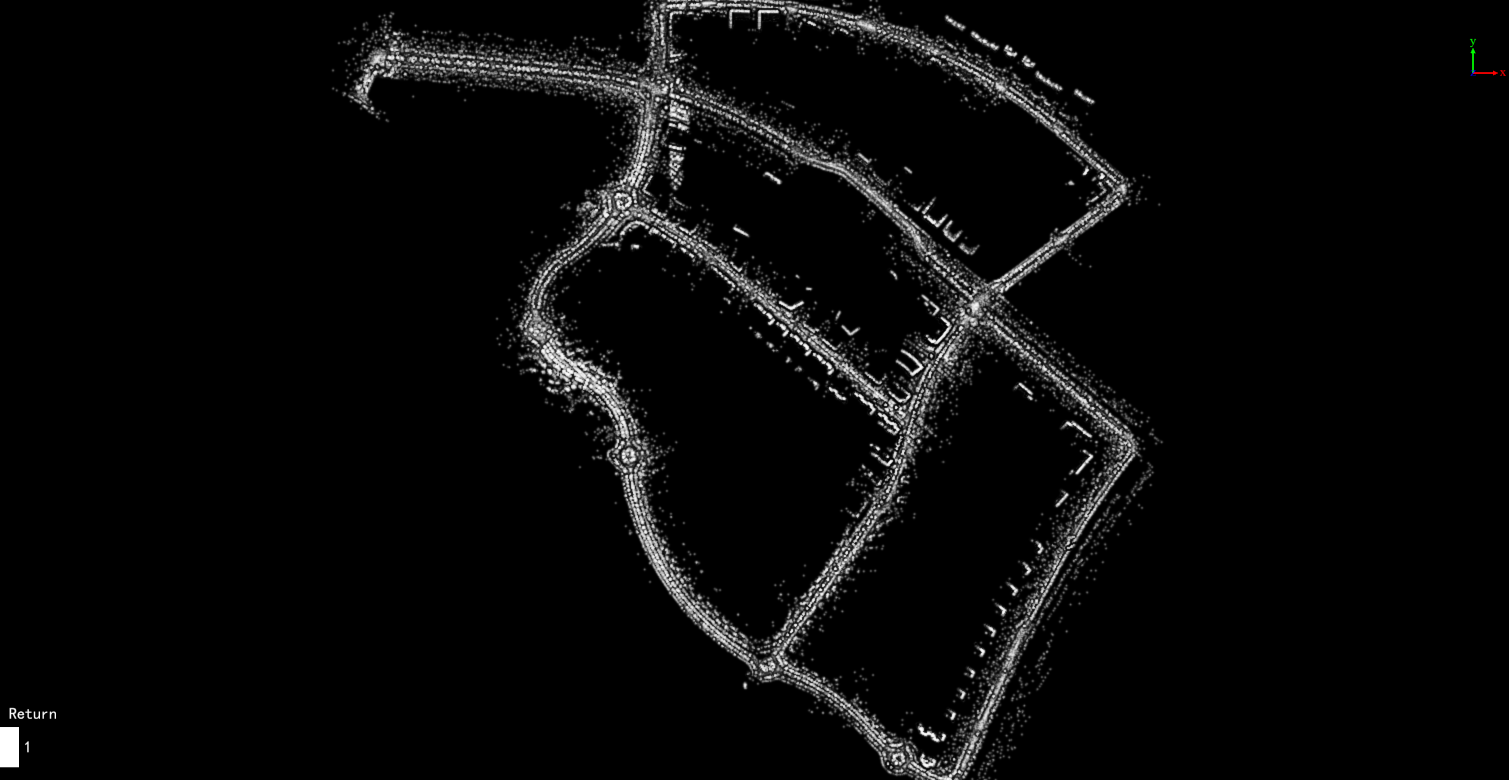
(5)Display by Return: Please refer to Display by Return Number for specific display effects.
(6)Display by Time: Please refer to Display by Time for specific display effects.
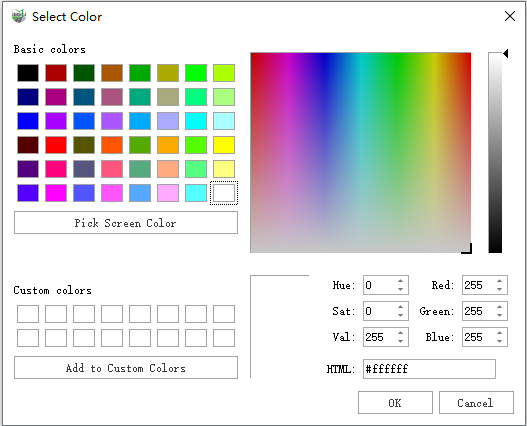
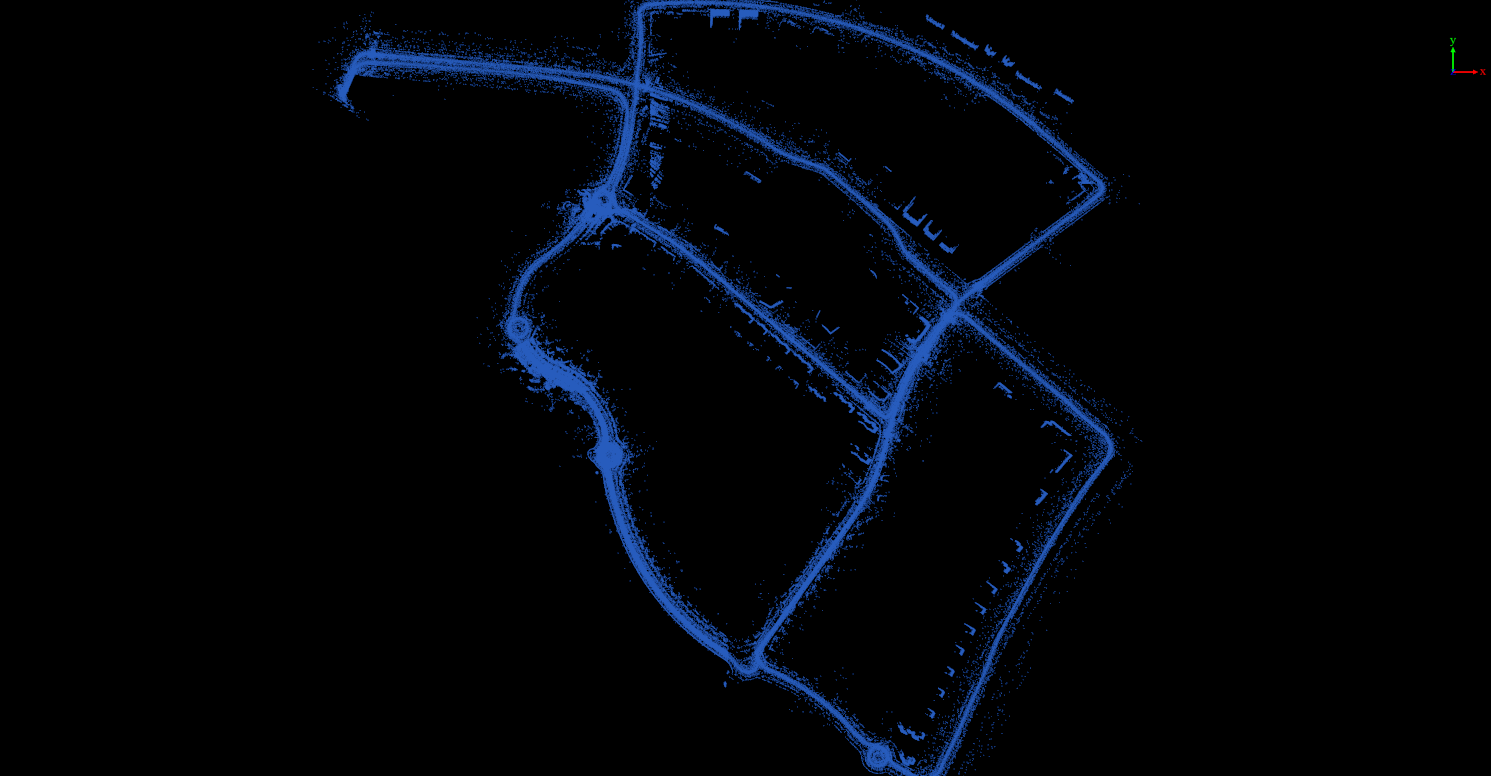
(7)Display by Selected: It allows you to choose a color in the color dialog and the selected point cloud will be displayed in a unified color. The color dialog is shown below:
The specific display effect is shown below:
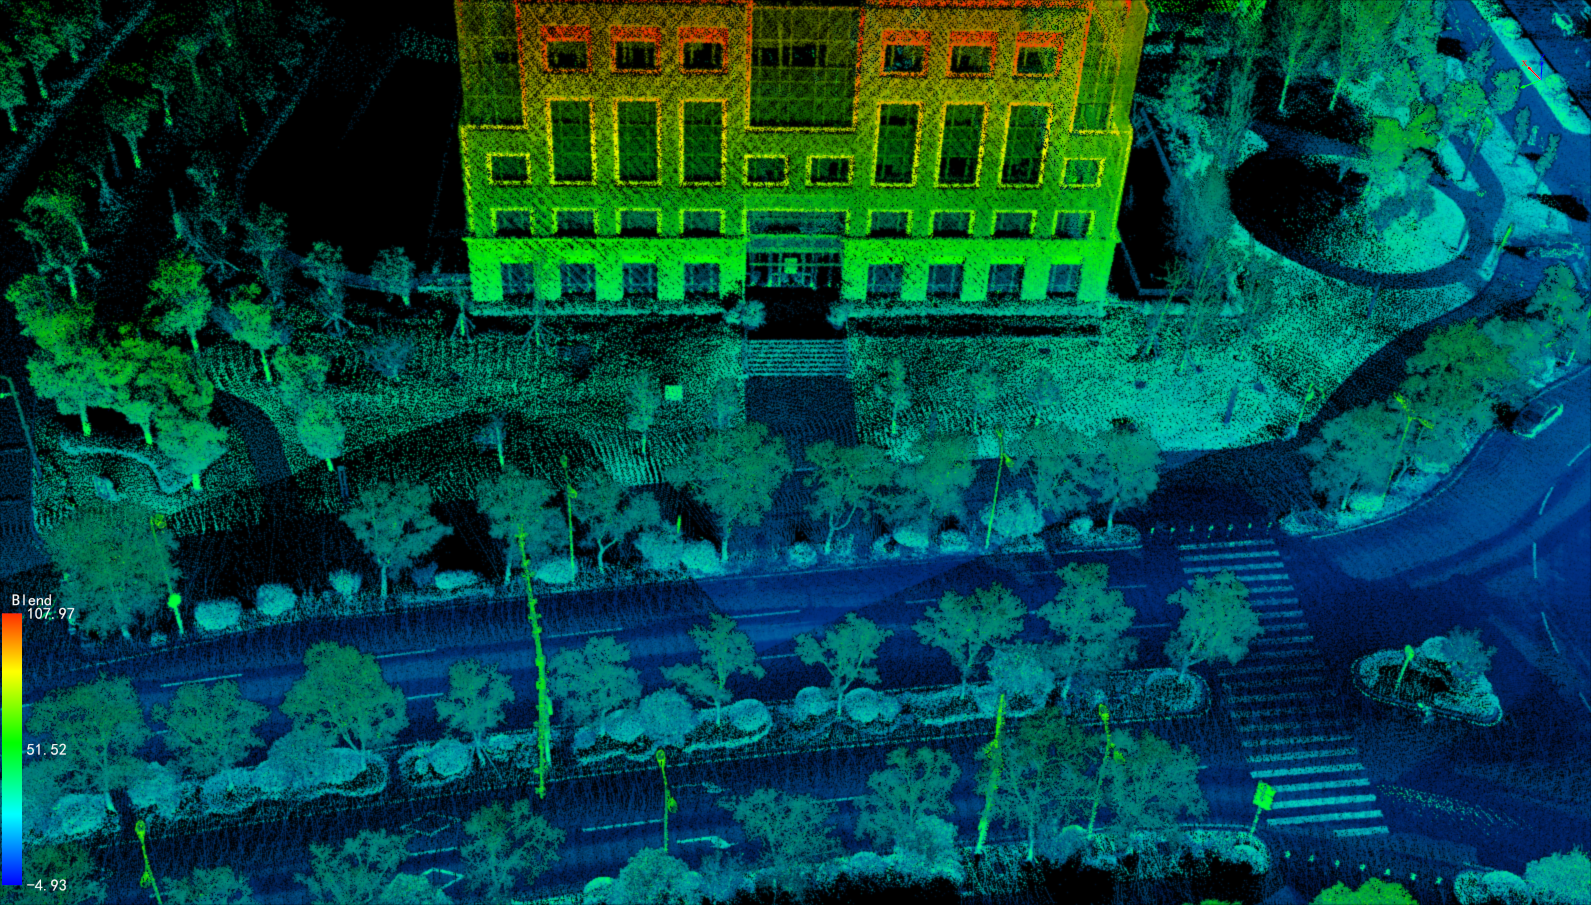
(8)Display by Blend: Used for displaying point cloud data by blending the elevation attribute and intensity attribute of the point cloud. The attributes are mapped to a uniformly changing color range, providing a more intuitive representation of the combined changes in elevation and intensity of the point cloud, as well as a clearer display of object classes and boundaries. The specific display effect is shown below:
(9)Display by User Data: Used for displaying point cloud data by mapping the user data attribute of the point cloud to different color values, providing a more intuitive differentiation of point cloud data with different user data. The specific display effect is shown below:
6.Point Brightness: Adjusting Point Cloud Display with Brightness and Contrast.:
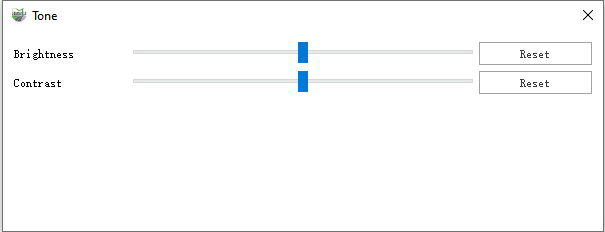
Before adjustment
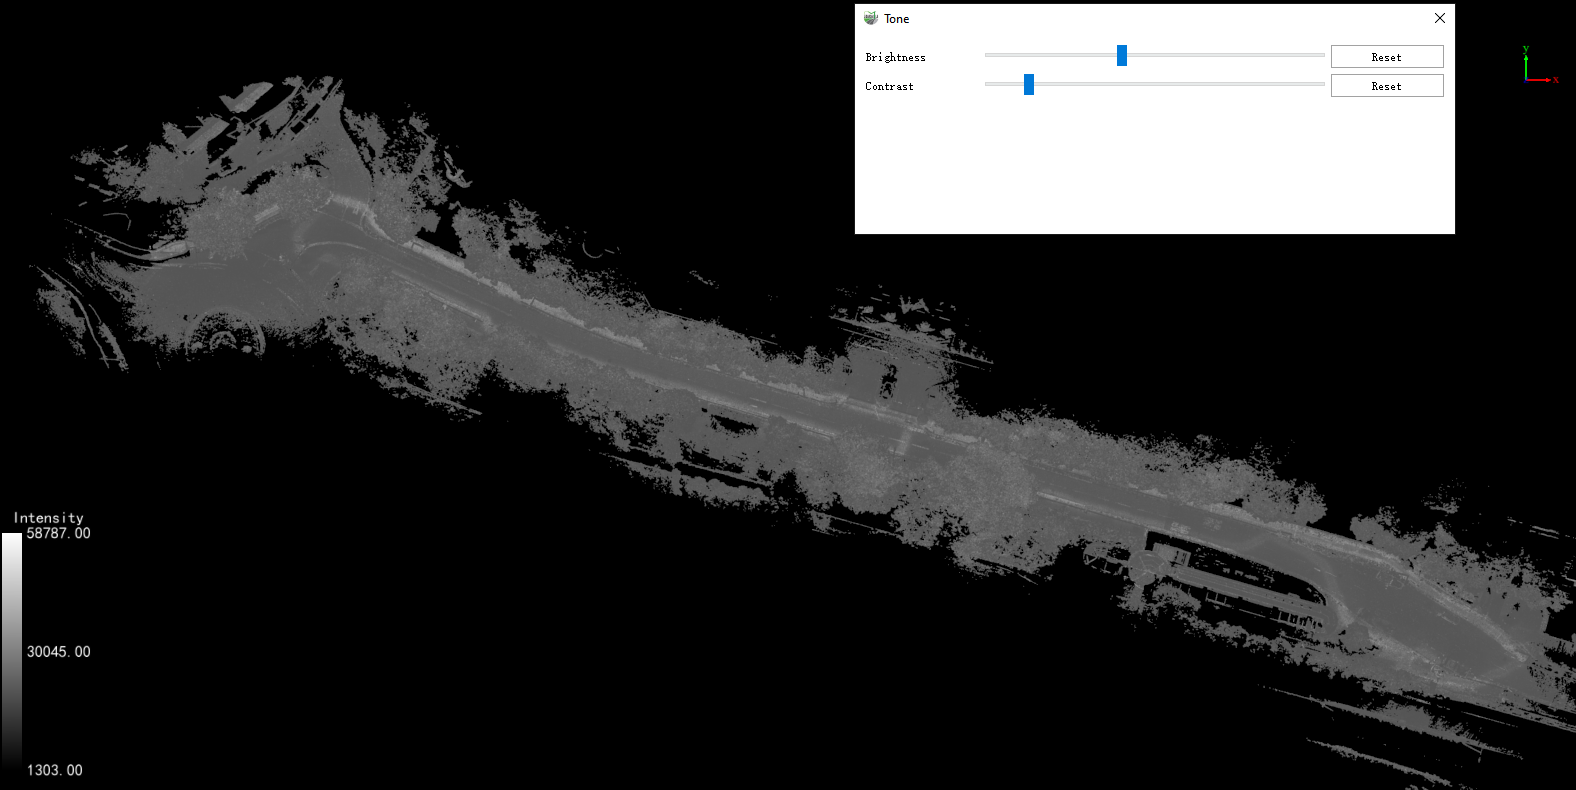
After adjustment
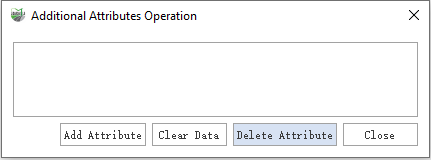
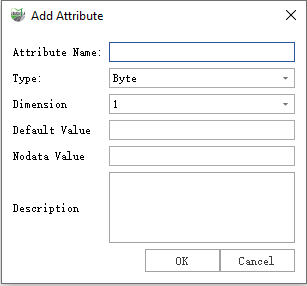
(1)To add an additional attribute: Click on 'Add Additional Attribute,' and a dialog will pop up. Set the additional attribute's name, type, dimensions, default value, NoData value, and description. After clicking 'OK,' the additional attribute will be successfully added.
The additional attribute names must be unique. If the newly added additional attribute already exists, you will be prompted that the additional attribute already exists. Please define another additional attribute.
(2)Select the additional attribute you want to operate on from the attribute list box.
(3)(Optional) Click on "Clear Data" to set the selected additional attribute component data to their corresponding invalid values. If the current point cloud color display mode is related to this additional attribute, switch the point cloud display to show by height.
(4)(Optional) Click on "Delete" to remove the selected additional attribute. If the current point cloud color display mode is related to this additional attribute, switch the point cloud display to show by height.
(5)Click the close button to exit the operation interface.
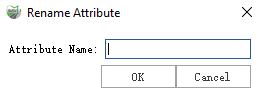
(6)(Optional) Click on "Rename Attribute" to open the Rename Attribute dialog box. Set the name for the additional attribute, and click OK to successfully add the additional attribute.
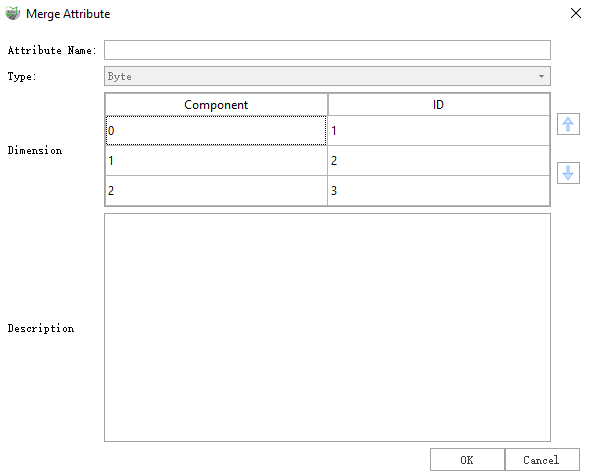
(7)(Optional) Click on Merge Attributes to open the Merge Attributes dialog box. Set the name and description for the new additional attribute, then click OK to successfully merge the additional attributes.
Only supports merging three additional attributes of the same type into a single additional attribute.
8.Restatistics: Recalculate the Mean Z, Std Z, Mean Intensity and Std Intensity of point cloud data. This function is used to repair older versions of LiData which may contain incomplete information.
9.Export: Export the individual point cloud data as LAS (.las, .laz) format.
10.Remove: Remove the current point cloud data.