Section Analysis
Functional Overview
The Section Analysis module is designed for road sections and tunnel sections. It mainly supports reference section line design, actual section extraction, overbreak and underbreak analysis, and report generation based on point cloud and model data. This function obtains measured sections at different positions or the actual terrain relief from measured data, supports editing and managing measured sections, and finally outputs section information and overbreak/underbreak reports.
It is recommended to use the Classify Ground Points by PTD class for section generation to obtain accurate section data.
Usage
Load point cloud or model data into the active window, and click Terrain > Section Analysis. The Section Analysis toolbar appears above the data display window.

From left to right, the toolbar contains: Editor, Create Reference Line, Import Reference Line, Extract Point Cloud Along Section, Generate Orthogonal Reference Line, Save Reference Section Line, Generate Road Section, Generate Tunnel Section, Show/Hide Vector Tools, Clear Tools, and Exit.
Click Editor > Start Editing.
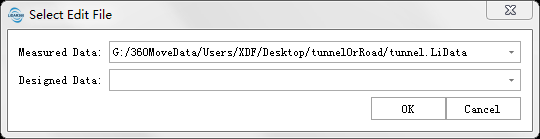
Select the point cloud or model data loaded in the window to start section analysis. You need to select measured data and design data. Measured data is used to generate the actual section (red by default), while design data is used to generate the design section. Measured data is required, and design data is optional. Overbreak/underbreak analysis can be performed after the actual section is generated only when design data has been selected. When both measured data and design data are TIN data, no class selection is required for road section generation.
Draw Centerline/Profile
Function Description: Create reference section lines by picking points with the mouse. Multiple reference section lines are supported.
Import Reference Section Line

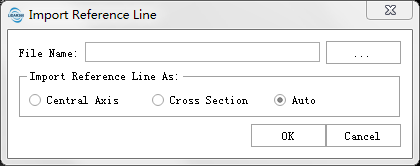
Function Description: Click this button to open the Import Reference Line interface. Text files (*.txt), graphics files (*.dxf), and vector files (*.shp) are supported.
For the imported result format, refer to Section Result File Format. When importing DXF files, text in the DXF is automatically matched as the reference line name. The matching method is to traverse all reference lines in the file, compare the positions of all text with the start and end positions of each reference line, and use the nearest text to the start or end point as the name of that reference line. The matched text will not be used by other reference lines. Reference lines without matched text are named automatically according to the current naming mode. For naming mode settings, refer to Settings in Generate Road/Tunnel Section. The following reference line types can be imported:
- Centerline: All reference lines are imported as centerlines.
- Cross Section: Reference lines containing only two points are imported as cross sections.
- Auto Match: Reference lines with more than two points are imported as centerlines; reference lines containing only two points are imported as cross sections. The intersection relationship with each centerline is automatically determined to obtain the appropriate name and mileage.
Create Secondary Centerline
After a centerline is drawn with the mouse or imported, this tool can be used to create secondary centerlines. A secondary centerline is generated by offsetting from the centerline by a specified distance perpendicular to the forward direction. A secondary centerline is also essentially a centerline and can be used to generate section diagrams like the main centerline. When the section diagram of the main centerline is displayed, if it has secondary centerlines, the secondary centerlines are drawn on the same section diagram using different colors. Secondary section diagrams are also displayed separately in the section manager. When reports are generated, such as DXF reports, secondary sections are also displayed on the same section block.
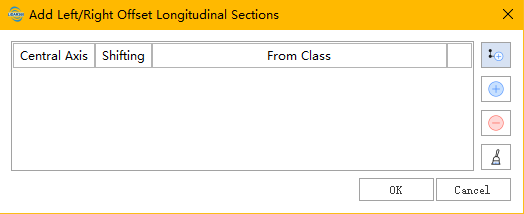
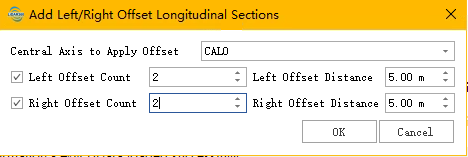
- Automatically Build Secondary Centerlines: Automatically builds secondary centerlines using a series of parameters. Each centerline can be assigned an initial class. This class is mainly used to select points of the corresponding class from the point cloud when generating section lines.
- Center Axis for Offset: The centerline from which the offset is generated.
- Left/Right Offset Count (Checked by default): Whether to add left/right secondary centerlines and the number of secondary centerlines to add. For example, if the offset count is 2 and the offset distance is 5, two centerlines are generated: the first offset by 5, and the second offset by 5 * 2 = 10.
- Left/Right Offset Distance: The offset distance of each centerline in the direction perpendicular to the centerline. If multiple centerlines are generated, the offset is accumulated automatically.
- OK/Cancel: Click OK to list the secondary centerlines to be generated in the table. Click Cancel to close the interface without any operation. The following figure shows the result after setting the left offset count to 3 and clicking OK.
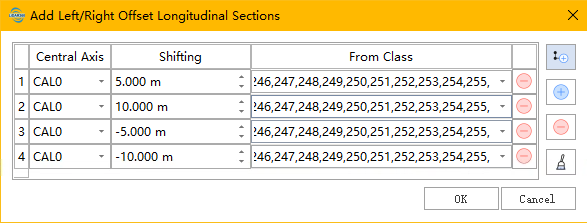
- Add Single Secondary Centerline: Adds one secondary centerline. After clicking, a row is added automatically. You can freely edit the attached centerline, offset distance, and initial class.
- Delete Single Secondary Centerline: Select a row in the header and click this button to delete it.
- Clear Secondary Centerlines: Clears all secondary centerlines.
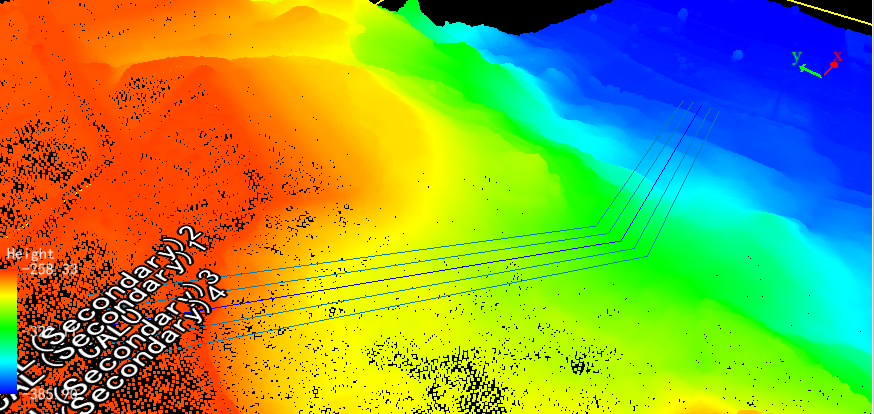
- OK/Cancel: Click OK to create the secondary centerlines in the table. Click Cancel to close the interface without any operation. The following figure shows the actual created result.
Extract Point Cloud Along Reference Section Line
Function Description: Click this button to extract point cloud data files around the reference centerline. If a model file is loaded, all triangulated mesh vertices within the model range are extracted.
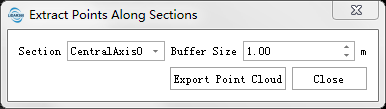
- Section: Select the reference centerline for point cloud extraction.
- Buffer Size (m) (Default: 1.00): The buffer distance perpendicular to the centerline/profile. For example, if the value is set to 100 m, the buffer extends 50 m on each side of the centerline.
Save Reference Section Line
Function Description: Click this button to open the Save Reference Line dialog box. The created reference section line data can be saved as txt, shp, or dxf files.
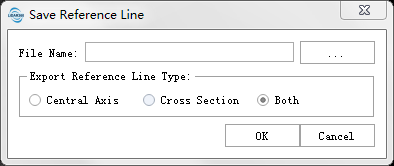
- Centerline: Export only centerlines and their names.
- Cross Section: Export only cross sections and their names.
- All: Export all reference lines and their names.
Automatically Add Reference Cross Sections
Function Description: This function generates multiple cross sections perpendicular to the reference centerline.
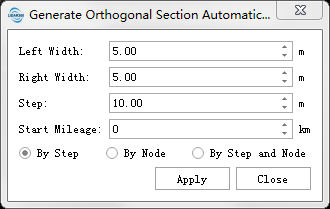
- Left Width (m) (Default: 5): Length of the left end of the reference cross section along the route direction.
- Right Width (m) (Default: 5): Length of the right end of the reference cross section along the route direction.
- Start Mileage (km) (Default: 0): Start mileage for generating reference cross sections. The mileage values of cross sections are accumulated from this value.
- Create Sections at Nodes: Creates cross sections at nodes of the profile/centerline. The cross section direction is perpendicular to the angle bisector at the node.
- By Step: Generates reference cross sections only at the specified step, without considering nodes.
- Step (m) (Default: 10): Step for generating reference cross sections along the centerline.
- By Slope: When there is an elevation difference between nodes of the profile/centerline, cross section positions can be calculated by slope. Slope is the ratio of horizontal length to elevation difference between two points, usually expressed as a percentage. In this mode, a larger slope produces more cross sections.
- Slope (%) (Default: 5): The program calculates the elevation difference of each centerline segment, calculates the horizontal step using the input slope value, and places cross sections using that horizontal step.
- Maximum Mileage Step (m) (Default: 10): Horizontal step threshold used together with the slope threshold. When the slope threshold is too small, the calculated step may be too large and too few cross sections may be generated. Setting the maximum mileage step ensures that a cross section appears at a certain interval on gentle slopes.
Manually Add Reference Cross Sections
Function Description: Click this button to enable manual reference cross-section generation. You can add cross sections at any position on the profile with the mouse.
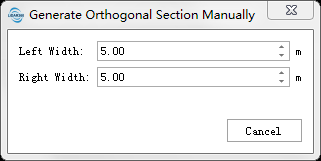
- Left Width (m) (Default: 5): Length of the left end of the reference cross section along the route direction.
- Right Width (m) (Default: 5): Length of the right end of the reference cross section along the route direction.
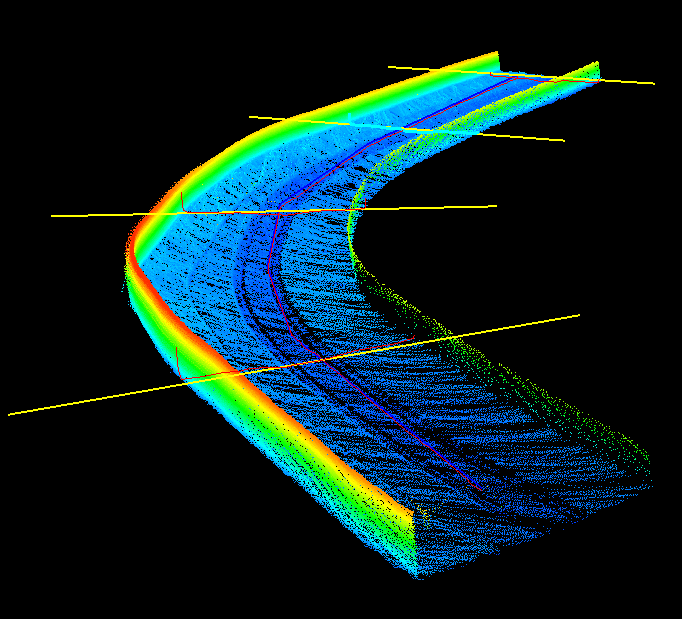
The cross section is shown below.
Generate Road/Tunnel Section
A cross-section diagram is a profile perpendicular to the road centerline at the center stake. In traditional surveying and mapping, the horizontal distance is used as the x-axis and elevation as the y-axis, and the section diagram is drawn on millimeter grid paper, usually at a scale of 1:100 or 1:200. Earthwork calculation and construction staking are based on this diagram. For road sections, points of any class (ground points by default) can be used to generate measured sections. The Distance Threshold and Maximum Edge Length can be adjusted to control the detail level of the section.
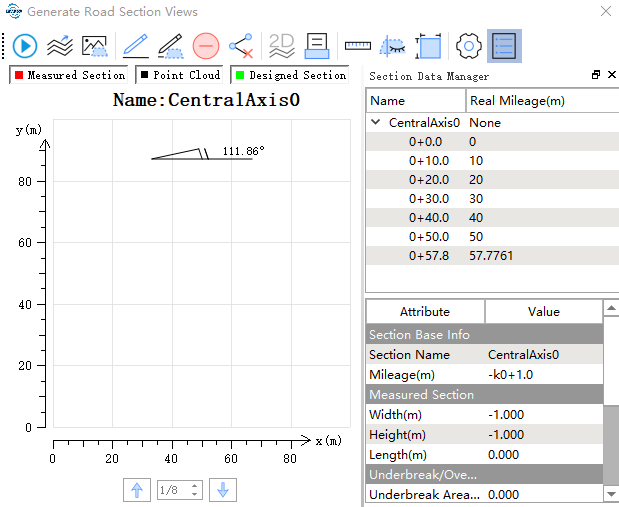
Function Description: Generate road section diagrams based on reference section lines.
The right side of the section diagram interface is the section manager. Double-click a node in the manager tree to jump to the corresponding section. The property information of this section is displayed in the property panel below. Click Calculate to open the parameter settings dialog box. Road sections and tunnel sections use different parameters.
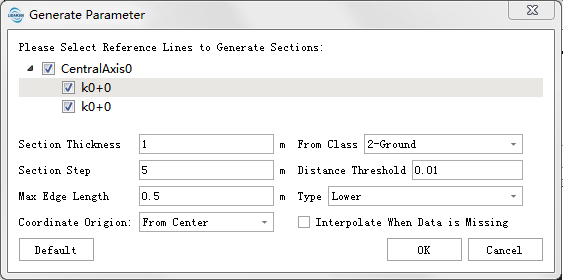
- Road Section Parameters:
- Select Reference Line: Select one or more reference lines for section generation from the list. All are selected by default. Reference lines in the list are grouped by their centerline. For road sections, centerlines can generate measured sections. Measured sections generated from selected reference lines overwrite old results.
- Section Thickness (m) (Default: 1): The range of the point cloud slice extracted along the centerline/profile direction. These points are used to calculate the actual section. When the point cloud is sparse, increase this value appropriately to preserve section details. A value 3 to 5 times the average point spacing is recommended.
- Source Class: Point cloud class used to generate the section. This item is hidden when both measured data and design data are TIN, because class selection is not required.
- Section Step (m) (Default: 5): The profile is segmented and simplified according to the Distance Threshold using the specified step. Points are interpolated by linear interpolation at integer multiples of the section step. If this value is set to 0, the entire section is simplified as a whole. A larger value retains fewer actual section points.
- Distance Threshold (Default: 0.01): The profile is simplified using the Douglas algorithm according to this parameter. A smaller value produces a more detailed section, while a larger value produces a more simplified section. After simplification, points may appear below the section line.
- Type: Generates the section diagram by elevation type.
- Bottom (Default): Uses the lowest point of the section data to generate the section diagram.
- Top: Uses the highest point of the section data to generate the section diagram.
- Maximum Edge Length (m) (Default: 0.5): Maximum segment edge length threshold. When Split Long Edges is selected, if the distance between two points in the section diagram is greater than this value, the line is split into two segments.
- Split Long Edges: Whether to split lines into multiple segments according to the edge length threshold. This must be used together with the Maximum Edge Length threshold.
- Yes: Split lines into multiple segments according to the edge length threshold.
- No (Default): Do not split lines according to the edge length threshold.
- Section Index: Select the section diagram displayed in the dialog box. The selected section diagram is highlighted in the window.
Function Description: Generate tunnel section diagrams from section lines.
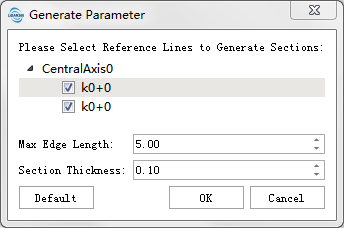
- Tunnel Section Parameters:
- Select Reference Line: Select one or more reference lines for section generation from the list. All are selected by default. Reference lines in the list are grouped by their centerline. For tunnel sections, centerlines do not generate measured sections. Measured sections generated from selected reference lines overwrite old results.
- Maximum Edge Length (m) (Default: 5): Maximum segment edge length threshold. If the distance between two points in the section diagram is greater than this value, the line is split into two segments. A larger value retains fewer actual section points.
- Section Thickness (m) (Default: 0.1): Width of point cloud data along the section line used to generate the section diagram.
Click Calculate to open the parameter settings dialog box, and click OK to generate the tunnel section diagram. You can pan and zoom the canvas with the mouse.
- Import Design Section: Import a parametric tunnel design section. A parametric tunnel section is represented by 2D coordinates, and its coordinate origin coincides with the position of the centerline at the corresponding cross section.
- Create from Parameters: Create a parametric tunnel section. Three tunnel design section types are currently supported.
- Delete: Clear design sections for all cross sections.
| Design Parameters | Design Section Effect |
|---|---|
| Single-center arch. It consists of a semicircular arch crown and a horizontal bottom. The crown radius and bottom position can be adjusted. | 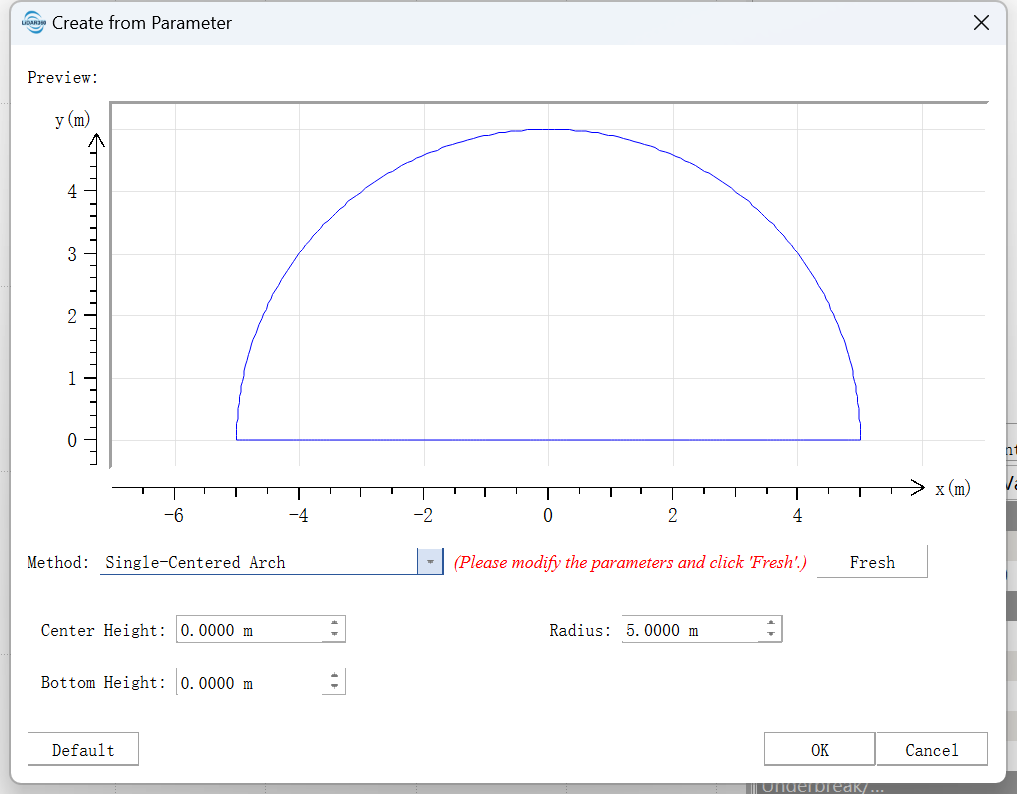 |
| Straight-wall semicircular arch. It consists of a semicircular arch crown, walls, and a horizontal bottom. The crown radius, wall height, and bottom position can be adjusted. | 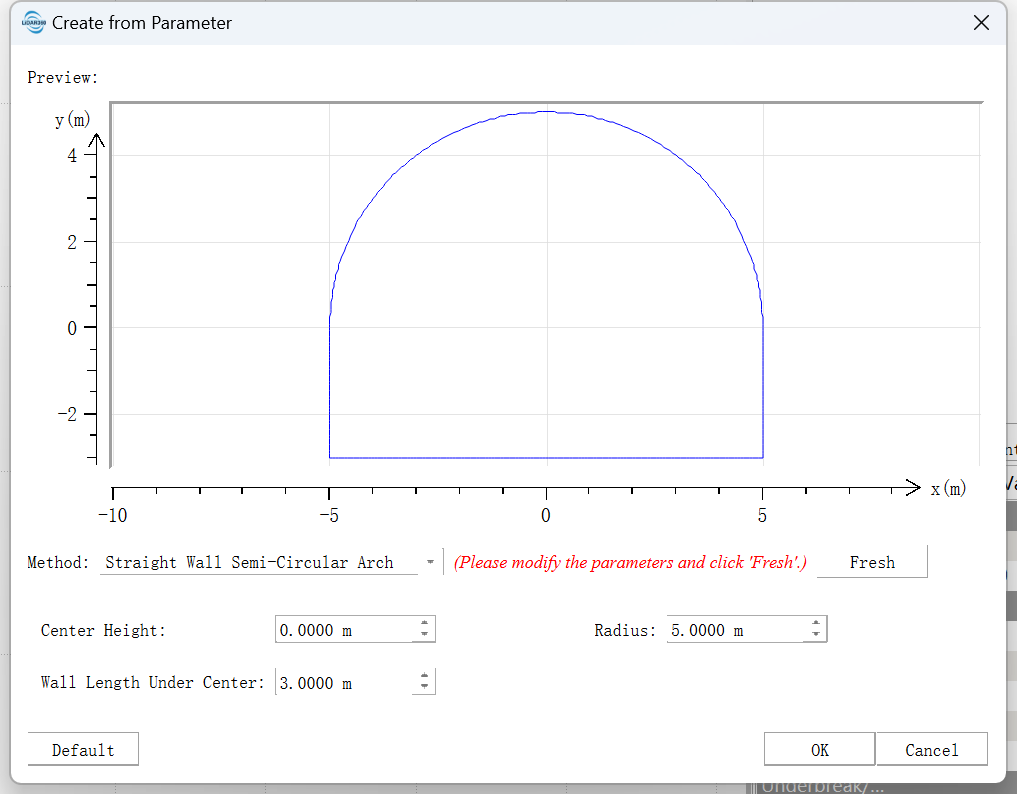 |
| Straight-wall circular arch. It consists of an arc-shaped crown, walls, and a horizontal bottom. The crown radius, expansion angle, wall height, and bottom position can be adjusted. | 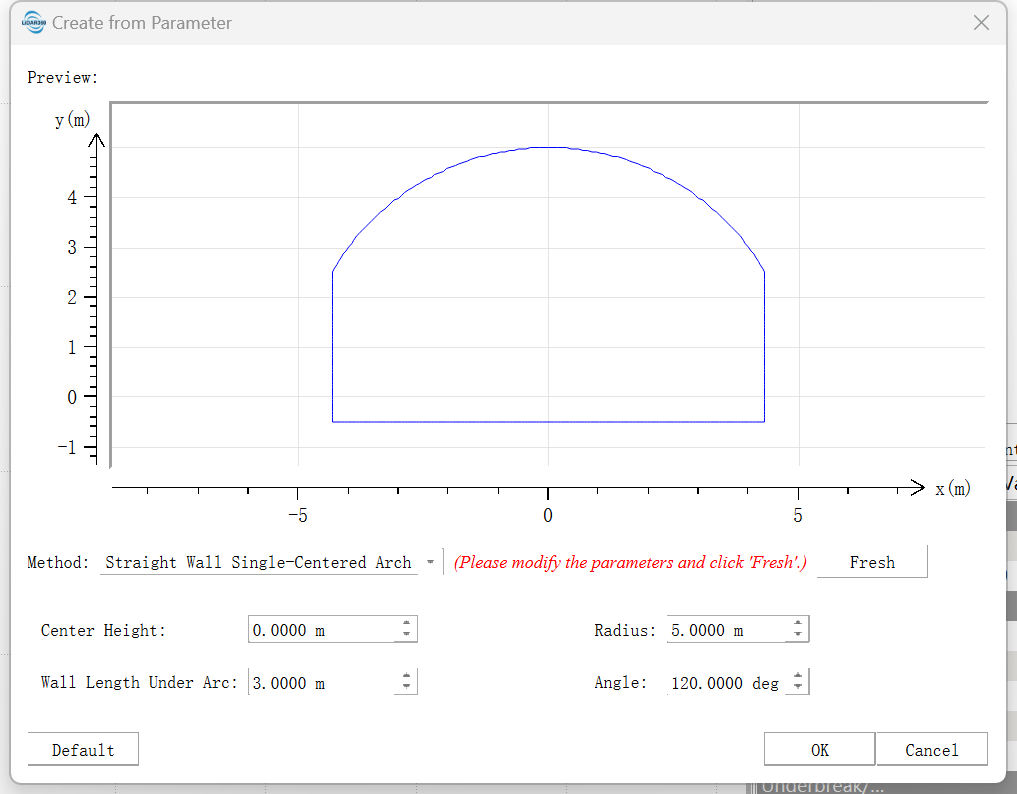 |
| Three-center arch, also called four-center arch. It consists of four tangent circles: top arch, two wall arches, and bottom arch. The center position and radius of each arch can be adjusted. | 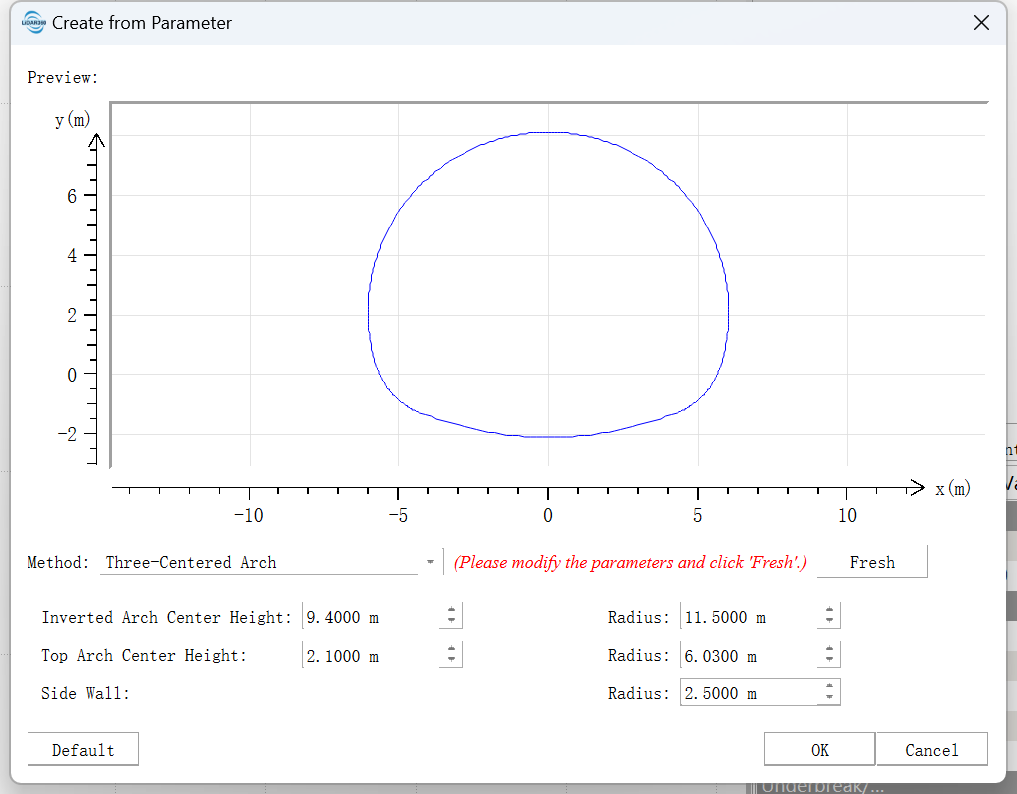 |
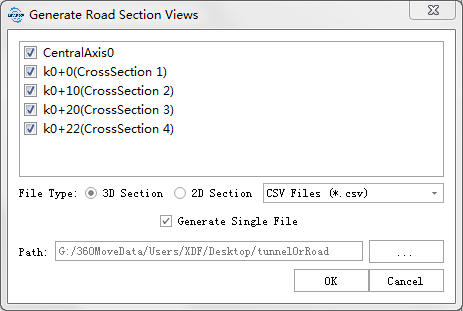
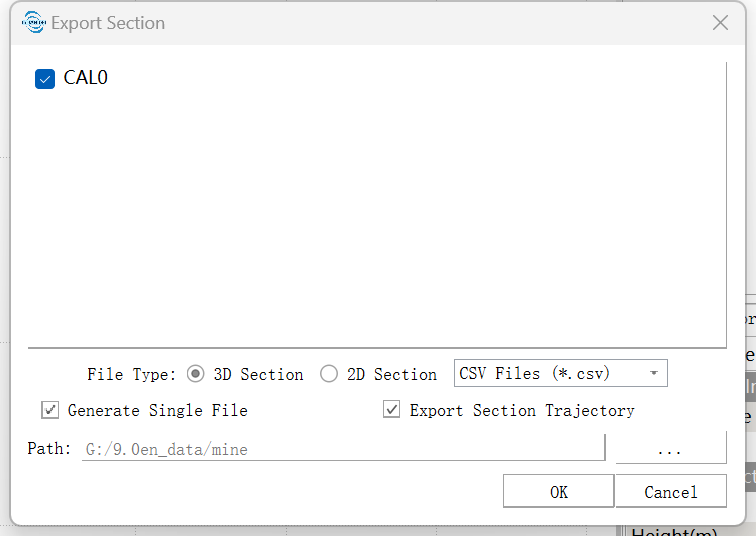
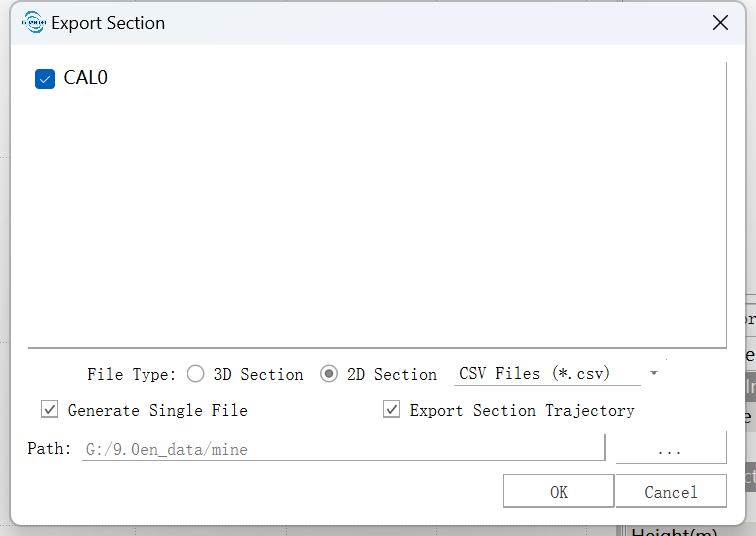
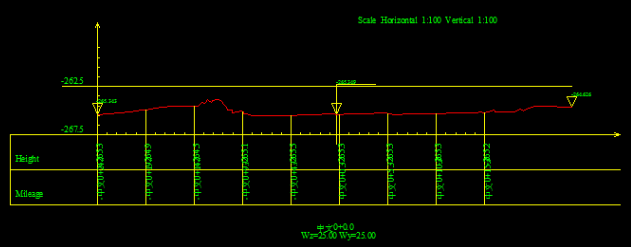
- Export Section: Export the currently generated section line and save it as one or more files. In the Chinese environment, csv, HDM, HDM (South), shp, dxf, and LandXML formats are supported. In the English environment, HDM format is not supported. LandXML1.2 and J-LandXML are supported for LandXML. Before exporting J-LandXML, select the correct coordinate system for the data. For result formats, refer to Section Result File Format. When exporting tunnel sections, you can also choose whether to export the section trajectory. The section trajectory is a CSV file that records the heading of the center stake and roof coordinates. More options are provided when exporting to 2D DXF:
- Add Elevation Label: Not checked by default. When selected, elevation labels are added to the section centerline and both ends.
- Draw Vertical Lines: Not checked by default. When selected, vertical lines are added to the section at the specified step. Each vertical line is labeled with elevation and distance from the origin.
- Vertical/Horizontal Scale: Scale of the generated DXF.
- Fill/Cut Prefix: If section comparison is performed, fill and cut labels can be added to the section. The prefix characters for fill and cut can be set here.
- Export Image: Save the current section diagram in the dialog box as an image. PDF format is supported. You can set the resolution and size of the exported section diagram in the export interface.
- Edit Section Line Nodes: Edit nodes of a tunnel section line. After editing is enabled, nodes can be dragged. This is used to edit incorrect tunnel boundaries or tunnel boundaries containing noise.
- Section Comparison: Compare the generated tunnel reference section and tunnel design section, and calculate fill/cut areas and total fill/cut volume. Fill and cut areas are displayed in different colors, which can be configured.
- The total fill/cut volume is calculated by multiplying the fill/cut area of the current mileage stake by half of the distance from the previous mileage stake to the current stake plus half of the distance from the next stake to the current stake. For the start and end mileage stakes, only the latter half and former half are calculated respectively. For example, if the current mileage stake is K0+80, the fill/cut area is S, the previous stake is K0+72, and the next stake is K0+90, the fill/cut volume is V = ((80 - 72) / 2 + (90 - 80) / 2) * S. The total fill/cut volume is obtained by summing the volumes of all mileage stakes.
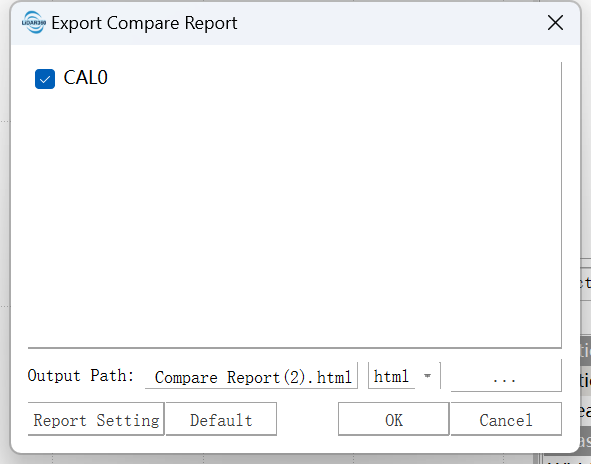
- Export Comparison Report: Export the current section diagram and section information on the canvas as a report to the specified folder.
- Distance Measurement: After distance measurement is enabled, click with the left mouse button on the canvas to pick points to measure. While picking, you can zoom and pan the canvas with the mouse. Double-click the left mouse button to complete measurement. Click Distance Measurement again to end measurement.
- Settings: Opens the settings dialog box.
- Display: Configure point cloud color, section node color, fill/cut colors, and other display settings.
- Section Naming: Name sections according to a specified naming pattern. It is divided into prefix and suffix. The prefix can be entered freely, and the suffix is mileage. Two formats are supported: mileage (km+m) and mileage.
- Show Section Properties: Show or hide the properties of the current section.
The section comparison result is shown below.

Section Quality Check
- Section Quality Check Report: Checks the current section or an imported section. Imported sections support only HDM format, and this function is available only in the Chinese language environment. Check items are listed below:
| Check Item | Description |
|---|---|
| Check sequential and duplicate mileage stake numbers of cross sections | Checks whether the mileage values in the cross-section file are sequential and whether duplicate values exist. |
| Check numeric sequence numbers of cross sections | Mainly checks sequential numbers, missing numbers, and duplicate numbers. The numeric sequence numbers of cross sections must be continuous in ascending order and must not contain duplicates or missing numbers. |
| Check distance misalignment from the center stake | Checks whether the distance values from the center stake in a single cross section are out of order. A single cross section uses the format "distance to the center stake, elevation" and is generated from left to right. Reverse folding, where x suddenly decreases, is not allowed. |
| Check elevation difference between cross-section points | Checks the elevation difference between adjacent elevation points in a single cross section. A threshold can be set; values exceeding the threshold are identified as abnormal elevation-difference points. |
| Check missing center-stake elevation in cross sections | Checks whether each cross section contains data whose distance to the center stake is 0. If missing, the cross-section data is incomplete. |
- Elevation Difference Threshold: Threshold used in the elevation difference check between cross-section points. Values exceeding this threshold are identified as abnormal elevation-difference points.
- Output Path: The generated section quality check report is generated in HTML format under the output path. The output report lists only sections that contain problems; items without problems are not listed.
Section Change Analysis
Function Description: Click this button to enable Section Change Analysis. This function compares roadway point clouds from two periods and generates comparison maps and analysis reports. The results include heat maps, changed areas, and section diagrams at the location of maximum change. The length of the comparison analysis image is calculated directly from the step and grid size, and the width is obtained adaptively from this value.
- Step (Default: 10) (m): Segmentation distance along the forward direction of the centerline. For example, if set to 10, the centerline is divided every 10 m. The maximum length of the generated comparison image is also 10 m.
- Roadway Class (Unchecked by default): If selected, only the selected roadway class is used. If not selected, all classes are used.
- Minimum Difference (Default: 0.3): Only changes greater than this value are calculated.
- Grid Size (Default: 0.1): Resolution of the generated comparison analysis image. For example, if Step is 10 m and resolution is 0.1, the length of the comparison analysis image is 100 pixels.
Show/Hide Vectors

Function Description: Click this button to show or hide vectors as needed, including drawn lines, orthogonal lines, section lines, and all vectors.
Clear Vectors

Function Description: Click this button to clear vectors as needed, including clear drawn lines, clear orthogonal reference lines, clear section lines, and clear all.
Exit

Function Description: Exit Section Analysis.