Click to View the Spectrum
Function Overview
Click the spectrum data in the import scene to display the spectral curve data of the selected pixel point.
Usage
Click Spectrum > Click to view spectrum to start the function, click on the spectral data in the scene, and a dialog box pops up to display the spectrum of the selected pixel point.
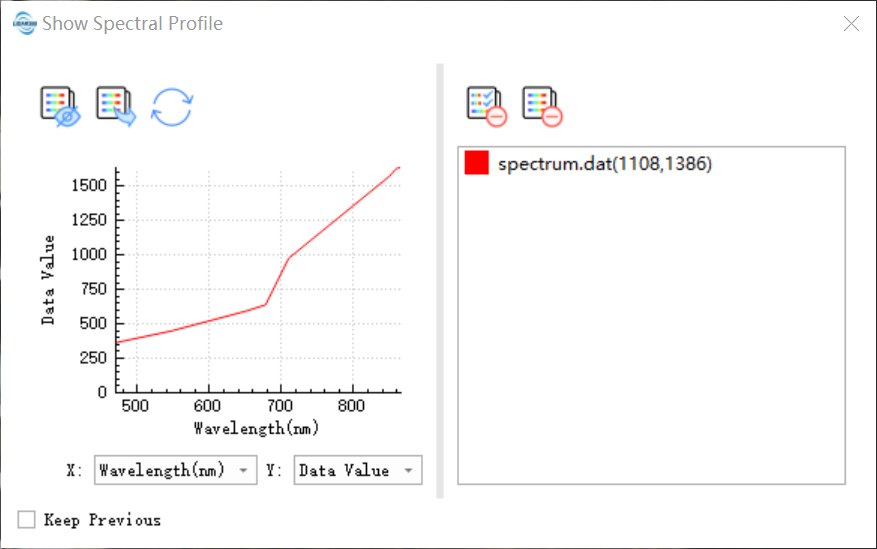
Expression and hidden legend: Controls the visible and hidden legend of the curve.
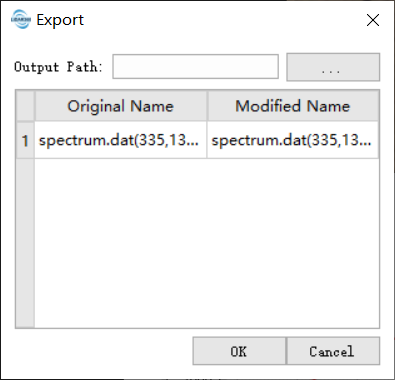
Export: Export spectral data in the graph. Supports modification of curve (spectral) names.
Refresh: Refresh the current data. The axis range can be restored to the initial display state.
Switch coordinates: If there is wavelength information in the spectral data, the horizontal coordinates can be switched into two forms: wavelength and index.
Retain existing curves: After checking, click to not remove the currently displayed curve. Hold down the shift key and click the same effect.
Remove selected curve: Removes selected curves from the curve list.
Remove all curves: Remove all curves from the curve list.