Forest Structure Change Detection
Function Overview
Forest Structure Change Detection uses the profile area change (PAC) metric of LiDAR data to quantify forest structure changes at multiple scales with a simple and integrated method. The method assumes that forest disturbance effects are inherently heterogeneous and cause different biomass losses at different height layers. These losses change canopy structure and therefore change the vertical distribution of LiDAR data. This method is useful for evaluating environmental and economic losses caused by forest fires and for providing information for forest restoration design.
Principle
First, the point cloud space is divided into grids according to the XSize and YSize set by the user. For each grid, all point heights inside the grid are normalized to the range of 0 to 1, sorted by height, and used to calculate cumulative height percentiles. A total of 100 cumulative height percentiles are calculated, representing the cumulative heights of 0% to 99% of the points in each statistical unit. These 100 cumulative height percentiles are fitted into a profile curve, and the area (PA) bounded by the percentile profile curve and the X axis is calculated. Finally, after the PA values before and after change are calculated, PAC is obtained by subtracting the pre-change PA value from the post-change PA value.
Usage
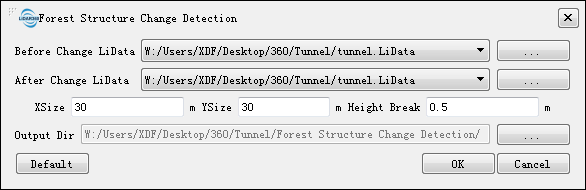
Click TLS Forest > Thematic Analysis > Forest Structure Change Detection.
Parameter Settings
Input Data: Input normalized point cloud data before and after change. For normalization, see Normalization. The data to be processed must be open in LiDAR360.
XSize (m) (default: 30): Grid length. This value should be greater than the individual tree crown width. For most forest types, the grid size should be greater than 15 m.
YSize (m) (default: 30): Grid width. This value should be greater than the individual tree crown width. For most forest types, the grid size should be greater than 15 m.
Height Threshold (m) (default: 0.5): Threshold used to divide the point cloud into layers. Only points higher than this threshold participate in the calculation.
Output Path: Output path. After processing, the result files include PA images before and after change, the PAC image, and a report file.
Default: Restore XSize, YSize, and height threshold to their default values.
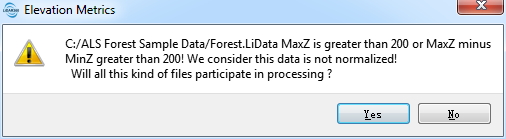
Note: Make sure the selected data is normalized ALS point cloud data.
@inproceedings{
    author={Tianyu Hu,Qin Ma,Yanjun Su,John J.Battles,Brandon M.Collins,Scott L.Stephens,Maggi Kelly,Qinghua Guo},
    title={A simple and integrated approach for fire severity assessment using bitemporal airborne LiDAR data},
    booktitle={Int J Appl Earth Obs Geoinformation,78(2019): 25-38},
    year={2019}
}