Raster Calculator
This tool is a spatial analysis tool. User can input raster data algebraic expressions, use operators and functions to do mathematical calculations, in order to establish selection queries, or enter raster data algebraic syntax.
Advantages of the raster calculator tool:
- Supports the use of variables in raster data.
- The ability to apply operators to three or more inputs of an expression.
- The raster calculator is used to execute single-line algebraic expressions through a simple, calculator-like tool interface, using a variety of tools and operators. When multiple tools or operators are used in an expression, the speed of execution is generally faster than executing each operator or tool separately.
Principle Description
Use the calculator buttons to enter values in expressions. Use the operator buttons to enter mathematical operators (addition, division, etc.) and logical operators (greater than, equal to, etc.) into expressions. By clicking these buttons, user can enter a number or operator into the current position of the pointer in the expression. The following are some examples of expressions that can be executed in the raster calculator tool. In these expressions, the raster layer name is enclosed in quotation marks, such as "dist@".
("pop@" > 150) & ("dist@" > 10)
(("reclass_rd_dist@" * 3) + ("reclass_landuse@" * 2) + "reclass_elev@") /6.0
("Band4@" - "Band3@") / Float("Band4@" + "Band3@")
Con("elev@" <= 3000, 1, 0)
Con(IsNull("elev@"),0, "elev@")
Con(("landuse1@" == 1) & ("landuse2@" == 5), "landuse1@" + "landuse2@", 99)
Usage
Click Data Management > Raster Tools > Raster Calculator.
Settings
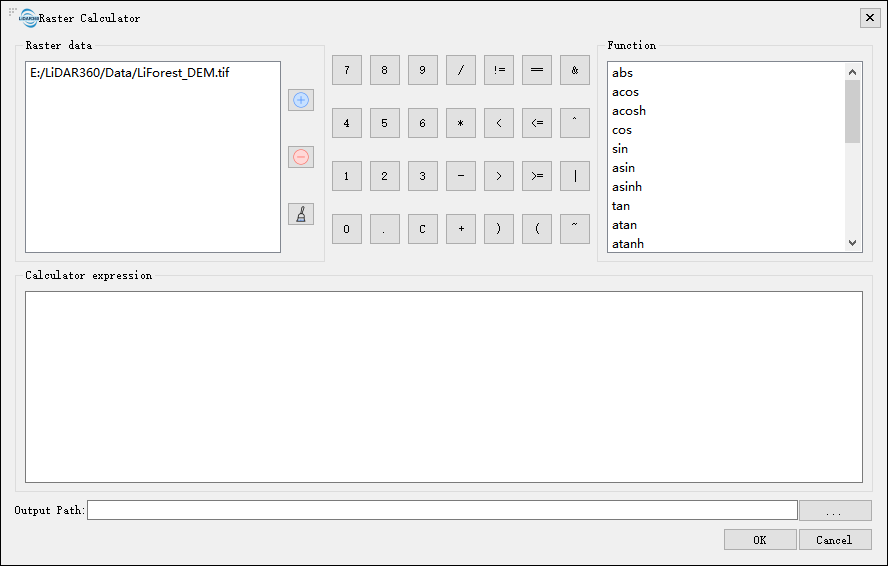
Raster Data:Display the raster data path (.tif) contained in the main interface, user can import the local raster data, perform expression calculations, and remove or clear the imported data.
Calculator Buttons:Contains number buttions 1, 2, 9, 0, etc. Algebraic operator buttions +, -, *, /, etc. Logical operators >, <, ==, etc. The major operation and logical buttons are as follows:
/ Divided by != Not equal to == Equal to & AND X Multiplied by < Less than <= less="" than="" or="" equal<="" td=""> ^ Exclusive OR - Minus > Greater than >= Greater than or equal | OR + Plus C Clear expression Not Boolean NOT Function:Lists functional capabilities including operators, trigonometric functions, mathematical analysis, logical and conditional analysis functions.
Function Description Expression Example + Add (Sum) the values of two rasters cell by cell. "Slop_2020@1" + "Slop_2018@1" - Subtracts the value of the second input raster from the first input raster on a cell-by-cell basis. "Slop_2020@1" - "Slop_2018@1" * Multiplies the values of two rasters cell by cell. "Slop_2020@1" * "Slop_2018@1" ^ Power "Slop_2018@1" ^ 2 / Performs integer division on the values of two rasters cell by cell. Slop_2020@1 / "Slop_2018@1" = Returns 1 for cells where the cell value equals a specified value, and 0 otherwise. ( "Slop_2020@1" = 1 ) OR ( "Slop_2020@1" = 2 ) != Returns 1 for cells where the first raster is not equal to the second raster, and 0 otherwise. "ASTGTM_N30E111I@1" > 0 > Returns 1 for cells where the first raster is greater than the second raster, and 0 otherwise. cos("Slop_2020@1" * 3.14 / 180) < Returns 1 for cells where the first raster is less than the second raster, and 0 otherwise. "ASTGTM_N30E111I@1" < 0 >= Returns 1 for cells where the first raster is greater than or equal to the second raster, and 0 otherwise. "ASTGTM_N30E111I@1" >= 50 <=< td=""> Returns 1 for cells where the first raster is less than or equal to the second raster, and 0 otherwise. "ASTGTM_N30E111I@1" <= 50<="" td=""> And Performs a Boolean AND operation on the cell values of two input rasters. If both input values are true (non-zero), the output value is 1. If one or both input values are false (zero), the output value is 0. ( "Slop_2020@1" = 29 ) AND ( "ASTGTM_N30E111I@1" > 200 ) Or Performs a Boolean OR operation on the cell values of two input rasters. If one or both input values are true (non-zero), the output value is 1. If both input values are false (zero), the output value is 0. ( ( "Slop_2020@1" = 29 ) OR ( "Slop_2020@1" = 30 ) ) AND ( "ASTGTM_N30E111I@1" > 200 ) Not Performs a Boolean NOT (complement) operation on each cell value of the input raster. If the input value is true (non-zero), the output value is 0. If the input value is false (zero), the output value is 1. Not( "Slop_2020@1") ABS Calculates the absolute value of each cell in a raster. ABS ( "tif01@1" ) if Performs an if/else conditional evaluation for each cell of the input raster. if ( "tif01@1" > 100,100,5) sin Calculates the sine of each cell in a raster. sin("Slop_2020@1" * 3.14 / 180) SinH Calculates the hyperbolic sine of each cell in a raster. ln( SinH("Slop_2020@1")) asin Calculates the arcsine of each cell in a raster. asin("Slop_2020@1") * 180 / 3.14 AsinH Calculates the inverse hyperbolic sine of each cell in a raster. ASinH("Slop_2020@1") cos Calculates the cosine of each cell in a raster. cos("Slop_2020@1" * 3.14 / 180) CosH Calculates the hyperbolic cosine of each cell in a raster. ln( CosH("Slop_2020@1")) acos Calculates the arccosine of each cell in a raster. acos("Slop_2020@1") * 180 / 3.14 ACosH Calculates the inverse hyperbolic cosine of each cell in a raster. ACosH("Slop_2020@1") tan Calculates the tangent of each cell in a raster. tan("Slop_2020@1" * 3.14 / 180) TanH Calculates the hyperbolic tangent of each cell in a raster. TanH("Slop_2020@1") atan Calculates the arctangent of each cell in a raster. atan("Slop_2020@1") * 180 / 3.14 AtanH Calculates the inverse hyperbolic tangent of each cell in a raster. ATanH("Slop_2020@1") atan2 Calculates the arctangent of each cell in a raster based on x,y coordinates. atan2("Slop_2020@1","Slop_2020@1") Exp10 Calculates the base-10 exponential value of each cell in a raster. ln(Exp10("Slop_2020@1")) Exp2 Calculates the base-2 exponential value of each cell in a raster. ln(Exp2("Slop_2020@1")) Exp Calculates the base-e exponential value of each cell in a raster. ln(Exp("Slop_2020@1")/ Power(10,38)) ln Calculates the natural logarithm (base e) of each cell in a raster. ln("Slop_2020@1") log2 Calculates the base-2 logarithm of each cell in a raster. log2 ( "Slop_2020@1" ) log10 Calculates the base-10 logarithm of each cell in a raster. log10 ( "Slop_2020@1" ) Sqrt Calculates the square root of each cell value in a raster. Sqrt("Slop_2020@1" ) MAX Compares cell values with another raster and retains the maximum value from both rasters as the result. MAX ( "Slop_2020@1","Slop_2021@1" ) MIN Compares cell values with another raster and retains the minimum value from both rasters as the result. MIN ( "Slop_2020@1","Slop_2021@1" ) Power Raises the cell values of a raster to the power of the corresponding cell values in another raster. Power("Slop_2020@1",2) Mod Calculates the remainder (modulo) of dividing the first raster by the second raster on a cell-by-cell basis. Mod(("Slop_2020@1")*2.3,"Slop_2021@1") Negate Changes the sign of each cell value in the input raster (multiplies by -1) on a cell-by-cell basis. Negate("Slop_2020@1") RoundUp Returns the smallest integer value greater than or equal to each cell value in the raster (represented as floating point). RoundUp("Slop_2020@1") RoundDown Returns the largest integer value less than or equal to each cell value in the raster (represented as floating point). RoundDown("Slop_2020@1") Float Converts the value of each raster cell to a floating-point representation. Float("Slop_2020@1") Int Converts each cell value of the raster to an integer by truncation. Int("Slop_2020@1") InList Determines which values from the first input raster are present in the set of other input rasters on a cell-by-cell basis. For each cell, if the value from the first raster is found in any of the other input rasters, that value is assigned to the output raster. If not found, the output cell will be NoData. InList("Slop_2020@1",[1,3,5]) 0ver When a cell value in the first input is not 0, the output value will be the corresponding cell value from the first input. If the cell value is 0, the output value will be from the corresponding cell of the second input raster. Over("Slop_2020@1","Slop_2021@1") Diff Determines which values of the first input logically differ from the values of the second input through cell-by-cell comparison. If the values of the two inputs differ, the value from the first input is used as the output. If the values are the same, the output is 0. Diff("Slop_2020@1","Slop_2021@1") Test Performs a Boolean evaluation of the input raster using a logical expression. If the expression evaluates to true, the output cell value is 1. If the expression evaluates to false, the output cell value is 0. Test("Slop_2020@1","Slop_2020@1">=2) IsNull Determines which cells in the input raster contain NoData values on a cell-by-cell basis. Returns 1 if the input value is NoData, otherwise returns 0. Con( IsNull("Slop_2020@1") ,0,"Slop_2020@1") Con Performs an if/else conditional evaluation for each cell of the input raster. Con("Slop_2020@1" >=3 ,6,7) setnull The Set Null function assigns NoData to identified cell locations based on specified conditions. If the condition evaluates to true, it returns NoData; if false, it returns the value specified by another raster. SetNull("Slop_2020@1" ,"Slop_2020@1","Slop_2020@1" =3) Pick The value of the position raster determines which raster from the input raster list will be used to obtain the output cell value. Pick("Slop_2020@1",[1,2,3]) Xor Performs a Boolean XOR operation on two input raster images. If one input value is true (non-zero) and the other is false (zero), the output is 1; otherwise, the output is 0. Xor("Slop_2020@1","Slop_2020@2") Calculator Expression:Use the calculator button to enter values in the expression, or use operators, functions, etc. to form a raster calculation expression with raster data, and display it in this panel.
Output Resolution: Allows setting the spatial extent of the current raster image and the output number of rows and columns.
Coordinate System: Displays the coordinate system of the currently selected raster.
Output Path:Select the output directory or .tif file path. This output raster represents the result value of the calculation expression.