Display Mode

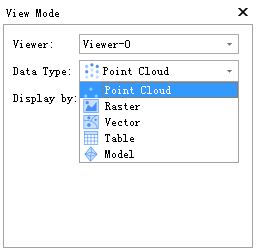
Function Description:Display or hide the display mode settings panel for the window. The settings panel is shown below.
Steps
- Select the window whose display mode needs to be configured.
- Select the data type to control rendering.
- Select a rendering mode from the rendering drop-down list. Point clouds currently support nearly 20 rendering modes, including display by elevation, intensity, classification, RGB, GPS time, tree ID, and mixed display.
- Set the rendering parameters. The corresponding window renders the data object according to the configured parameters.
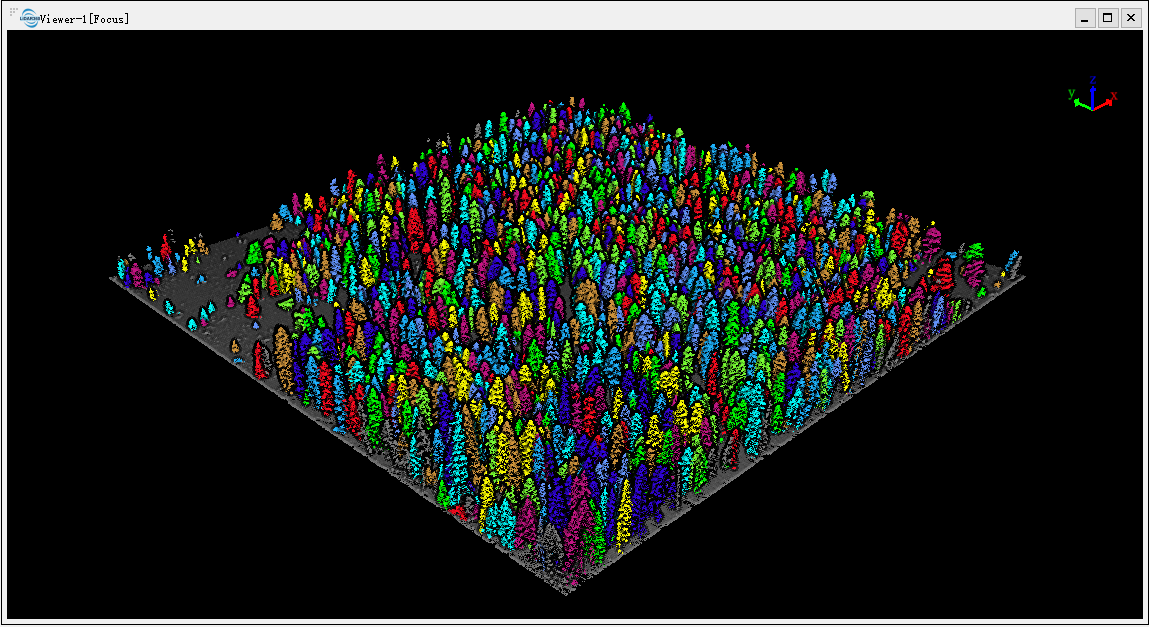
The following image shows the rendering by tree ID:
Display by RGB
- Select the window to set the display mode.
- Choose the type of point cloud.
- Select "Display by RGB" to show the point cloud according to its RGB properties.
- Click on the color selection button and a pop-up window will appear for selecting colors. Set up your desired color in this window or click on "Pick Screen Color" button, then click on a pixel in the point cloud window that you want to pick (for example ground color). Click "OK" when finished with color selection.
- Check "Certain color display", which will bring up a buffer setting interface where you can choose to display only points with selected colors (for example, only showing ground points).
- Modify buffer values to adjust allowed range of displayed colors. The left image below shows display by RGB while right image shows specified color rendering.
Display by Classification
- Select the window whose display mode needs to be configured.
- Select the point cloud data type.
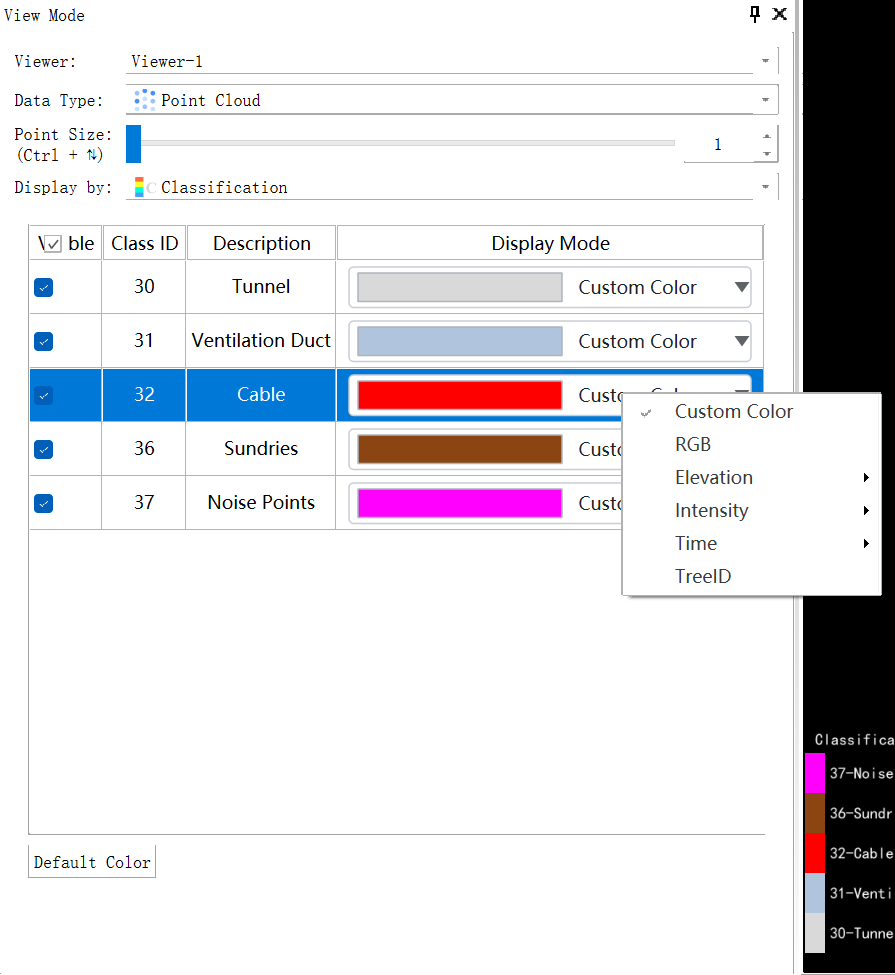
- Select Display by Classification. The point cloud is rendered according to classification information.
- After selecting a single class to view, you can continue rendering the data inside that class by elevation, RGB, intensity, TreeID, and other attributes.
- Multi-attribute display within a single class enables multidimensional visual analysis of data differences inside the same classification.
Vector Display
Vector data supports four display modes: Height, File, Contours, and Layers.
- Height: Colors are assigned based on the elevation of the vector data.
- File: Different vector files are assigned different color schemes.
- Contour: Displays contours based on elevation data.
- Layer: Different layers are displayed with different colors, with visibility control for individual layers.
Note: This mode is only applicable to .shp files generated from point clouds.
Raster Display
Raster data supports Single Band, Hillshade, and Classification display modes.
- Single Band: Displays raster data based on the cell values. Supports selection of different color ramps and overlaying of hillshade.
- Hillshade: Applies hillshade rendering using grayscale imagery.
- Classification: Displays different classes in different colors according to the classification information in the raster data.
Table Display
Table data supports Elevation and File display modes. 1.Height: Displays based on the elevation of the coordinates in the table file. 2.File: Different table files are displayed with different colors, which can be customized.
Model Display
Models support display modes by Height, Class, Texture, Semantic, and Vertex Color.
- Height: Displays the model based on its elevation.
- Class: Displays the model in a single color, which can be customized.
- Texture: For models with textures (e.g., .LiModel, .LiBIM files), display by the texture colors.
- Semantic: For .LiBIM files, roofs, walls, and ground are displayed in different colors.
- Vertex Color: For models with vertex colors (e.g., .obj files generated from surface reconstruction), displays as a colored model based on vertex colors.
Supports changing model data transparency.