View Spectral Library
Function Overview
View the software built-in and user-defined spectral data. The built-in spectral library uses the USGS7.0 version of the spectrum library. USGS V7.0引用:Kokaly, R.F., Clark, R.N., Swayze, G.A., Livo, K.E., Hoefen, T.M., Pearson, N.C., Wise, R.A., Benzel, W.M., Lowers, H.A., Driscoll, R.L., and Klein, A.J., 2017, USGS Spectral Library Version 7: U.S. Geological Survey Data Series 1035, 61 p., https://doi.org/10.3133/ds1035
Usage
Click Spectrum > View Spectrum Library .
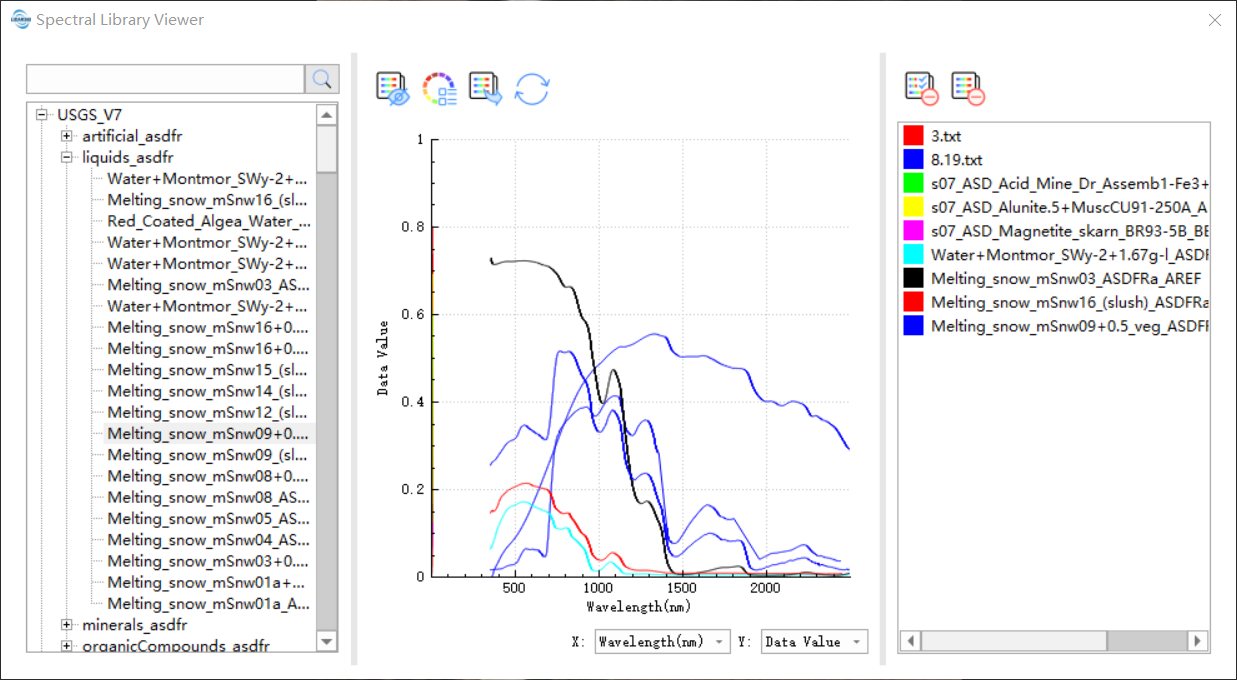
It is divided into three parts. The data items in the spectrum library are displayed on the left, and the figure is shown in the middle. After clicking on the data items on the left, it will be displayed in the figure, and the data items displayed on the right are the names of the data items.
Expression and hidden legend: Controls the visible and hidden legend of the curve.
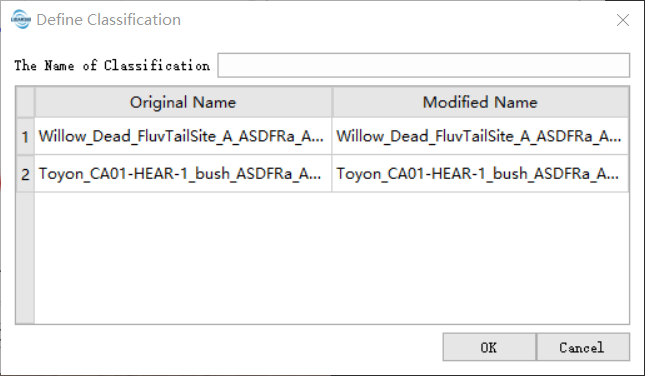
Define category: Define the spectral curve in the graph as a category and place it in the spectral library. Supports name modification. The defined data will be displayed in the Custom Spectral Data section on the left, which supports viewing. Right-click any area on the left to add a defined spectrum, and right-click the specific custom spectrum data to modify or delete.
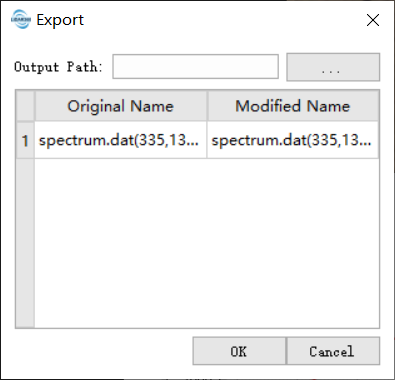
- Export: Export spectral data in the graph. Supports modification of curve (spectral) names.
Refresh: Refresh the current data. The axis range can be restored to the initial display state.
Switch coordinates: If there is wavelength information in the spectral data, the horizontal coordinates can be switched into two forms: wavelength and index.
Retain existing curves: After checking, click to not remove the currently displayed curve. Hold down the shift key and click the same effect.
Remove selected curve: Removes selected curves from the curve list.
Remove all curves: Remove all curves from the curve list.