Gap Fraction
Functional Overview
Gap fraction is the probability that light rays pass through the canopy and reach the surface without being intercepted. It is a key variable to describe the spatial distribution of canopy structure and biomass.The denser the distribution of the crown layer, the smaller the porosity. The range of porosity is between 0.0 and 1.0.
Principle Description
For each statistical cell, a 3D grid is first constructed according to the set grid spacing. Then, according to the constructed 3D gird, the total number of 3D girds in each layer and the number of girds containing laser points are counted, and the frequency of laser points in each layer is calculated.

Among them, ![]() </img> is the Sth layer’s frequency of laser points,
</img> is the Sth layer’s frequency of laser points, ![]() is the s-th layer’s total number of grids containing laser points,
is the s-th layer’s total number of grids containing laser points, ![]() is the Sth layer’s total number of three-dimensional grids.
Then calculate the gap fraction of the s-th layer:
is the Sth layer’s total number of three-dimensional grids.
Then calculate the gap fraction of the s-th layer:
Finally, the gap fraction of each layer was accumulated to obtain the gap fraction of the whole statistical unit:

Usage
Click TLS Forest > Gap Fraction to generate a porosity tif file.
Parameters Settings
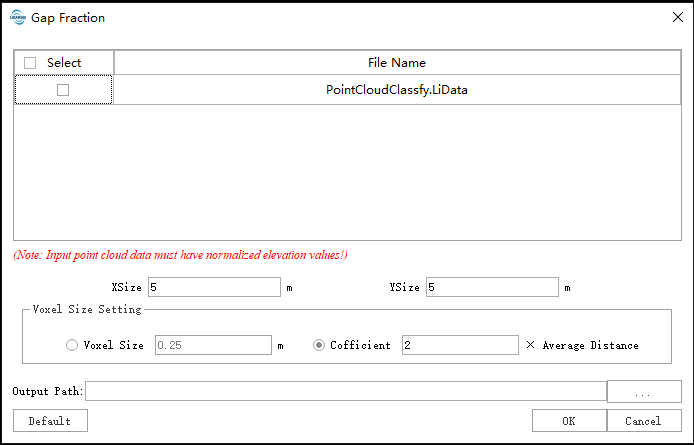
Input data: Ensure that each input point cloud data is normalized; the input file can be a single data file or a point cloud data set; the file(s) to be processed must be opened in the LiDAR360 software.
- X Size (meter) (default value: "5"): For the data acquired from most of the forest, this value should be larger than 5.
- Y Size (meter) (default value: "5"): For the data acquired from most of the forest, this value should be larger than 5.
- Voxel Size Settings:
- Voxel Size (meter) (default value: "0.25"): Count the grid size of the point cloud in the cell into 3D grids.
- Coefficient (default value: "2"): According to the average spacing of the point cloud, the coefficient factor of the 3D mesh size in the statistical unit is automatically calculated.
- Output Path: The output path of a corresponding TIFF file which is generated by each input point cloud data after running.
Note: If the maximum Z value of the point cloud is greater than 200 or the maximum Z minus the minimum Z is greater than 200, the data is considered to be unnormalized, and the software will pop up the prompt message shown in the figure below, click "YES", this type of data Still participating in the calculation, click "NO", this type of data will not participate in the calculation, and the user can re-select the data that meets the conditions.