Forest Health Vegetation Analysis
Function Overview
Using Forest Health Vegetation Tool to create spatial distribution maps that reflect the overall health of forest areas. These maps can be applied to detect occurrences of pests, diseases, and blight, as well as to assess timber harvest potential.The Forest Health Tool divides the input scene into nine classes(1-9), from weakest, or least healthy forest, to healthiest forest.
Usage
Click Spectrum > Forest Health Vegetation Analysis.
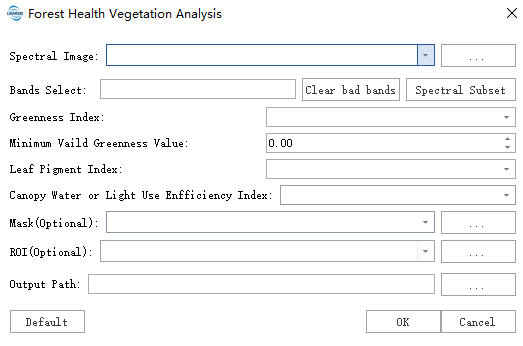
Click the Spectrum Subset button to select the band of the hyperspectral image.

Parameter Setting
- Input hyperspectral image data: Input the hyperspectral image data file. Data should be pre-processed, such as radiation calibration and atmospheric correction.
- Band selection: Select the band of the hyperspectral image. For PCA function, please click Clear the bad band before using it.
- Greenness index: Select greenness index. Currently only NDVI is supported.
- Minimum valid greenness value: Range 0-1. Any pixels in the image with values below this threshold will be masked in the classification results. Default is 0.
- Leaf Pigment index: Select the Leaf Pigment index. Currently, only CRI1 and ARI1 are supported.
- Canopy water or light use enfficiency index: Select the Canopy water or light use enfficiency index. Currently, only WBI, NDWI, PRI, and SIPI are supported.
- ROI: Only the minimum external rectangle in the ROI area is calculated after selection.
- Mask: Only the effective area of the mask is calculated after selection.
- Output path: The generated tif path.