Model Builder
Description
The Model Builder is a visual workflow design tool for creating, editing, and managing data processing models. It connects data processing tools through a graphical interface to form automated workflows, creating reusable models that significantly improve the efficiency of point cloud application analysis.
Basic Operations
1. Interface Layout
After opening the Model Builder,
- Main Canvas: Located centrally, displaying the graphical workflow of the model, including tools, data, and connection arrows.
- Operation Panel: Located at the top, containing functional operation buttons such as model file operations, model canvas operations (select, delete, undo, redo, add parameters), model run/stop, and exit builder.
- Data Directory Tree: Located on the upper left, allowing users to drag required data from the directory tree to the canvas.
- Model Toolbox: Located on the right, allowing users to drag required processing tools from the toolbox to the canvas.
2. Adding Processing Tools
Drag the required processing tools from the right-side Model Toolbox to the canvas. The following uses the CHM processing workflow as an example, which includes: ground point classification, DEM generation, DSM generation, and CHM processing. First, drag the above processing tools from the toolbox.
3. Connecting Processing Logic
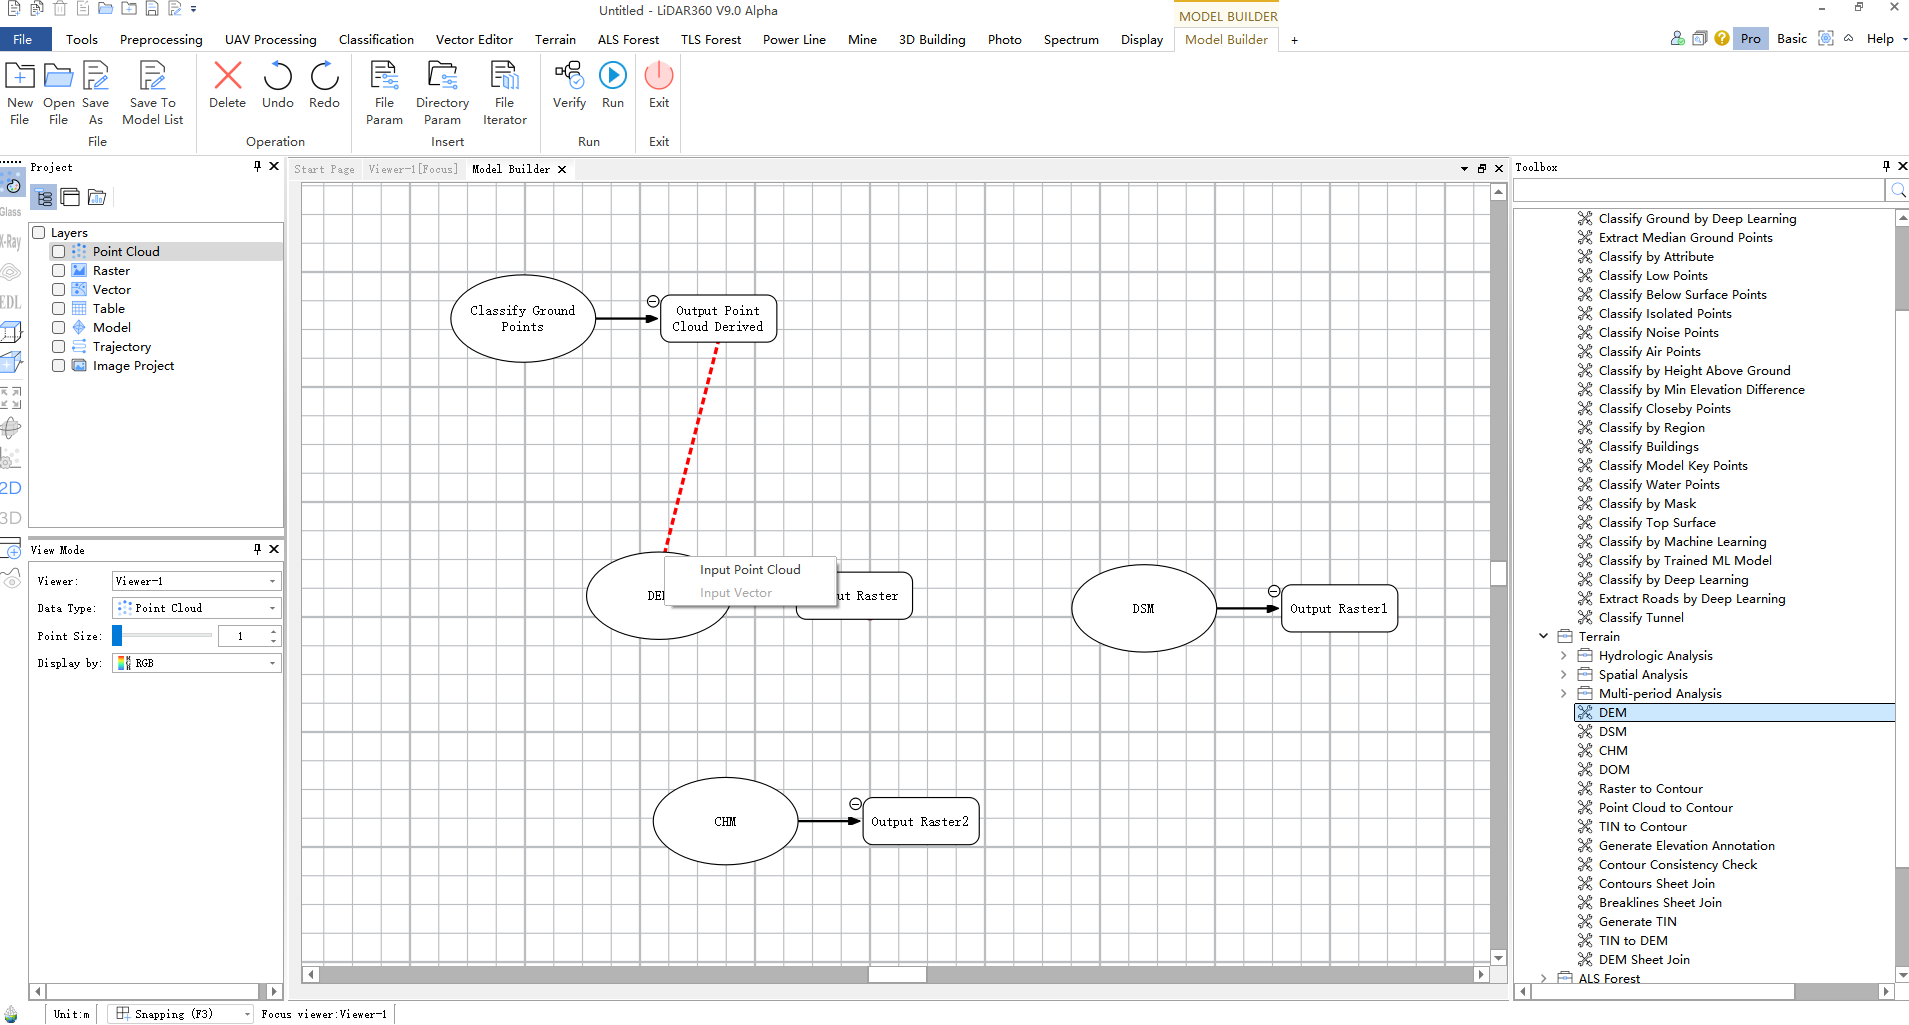
After dragging tools to the canvas, connect the processing workflow. The connection is made by clicking the output port (square) of one tool and dragging it to the target tool (ellipse). After dragging, the target tool will pop up options for its input port. Select the required option, as shown below:
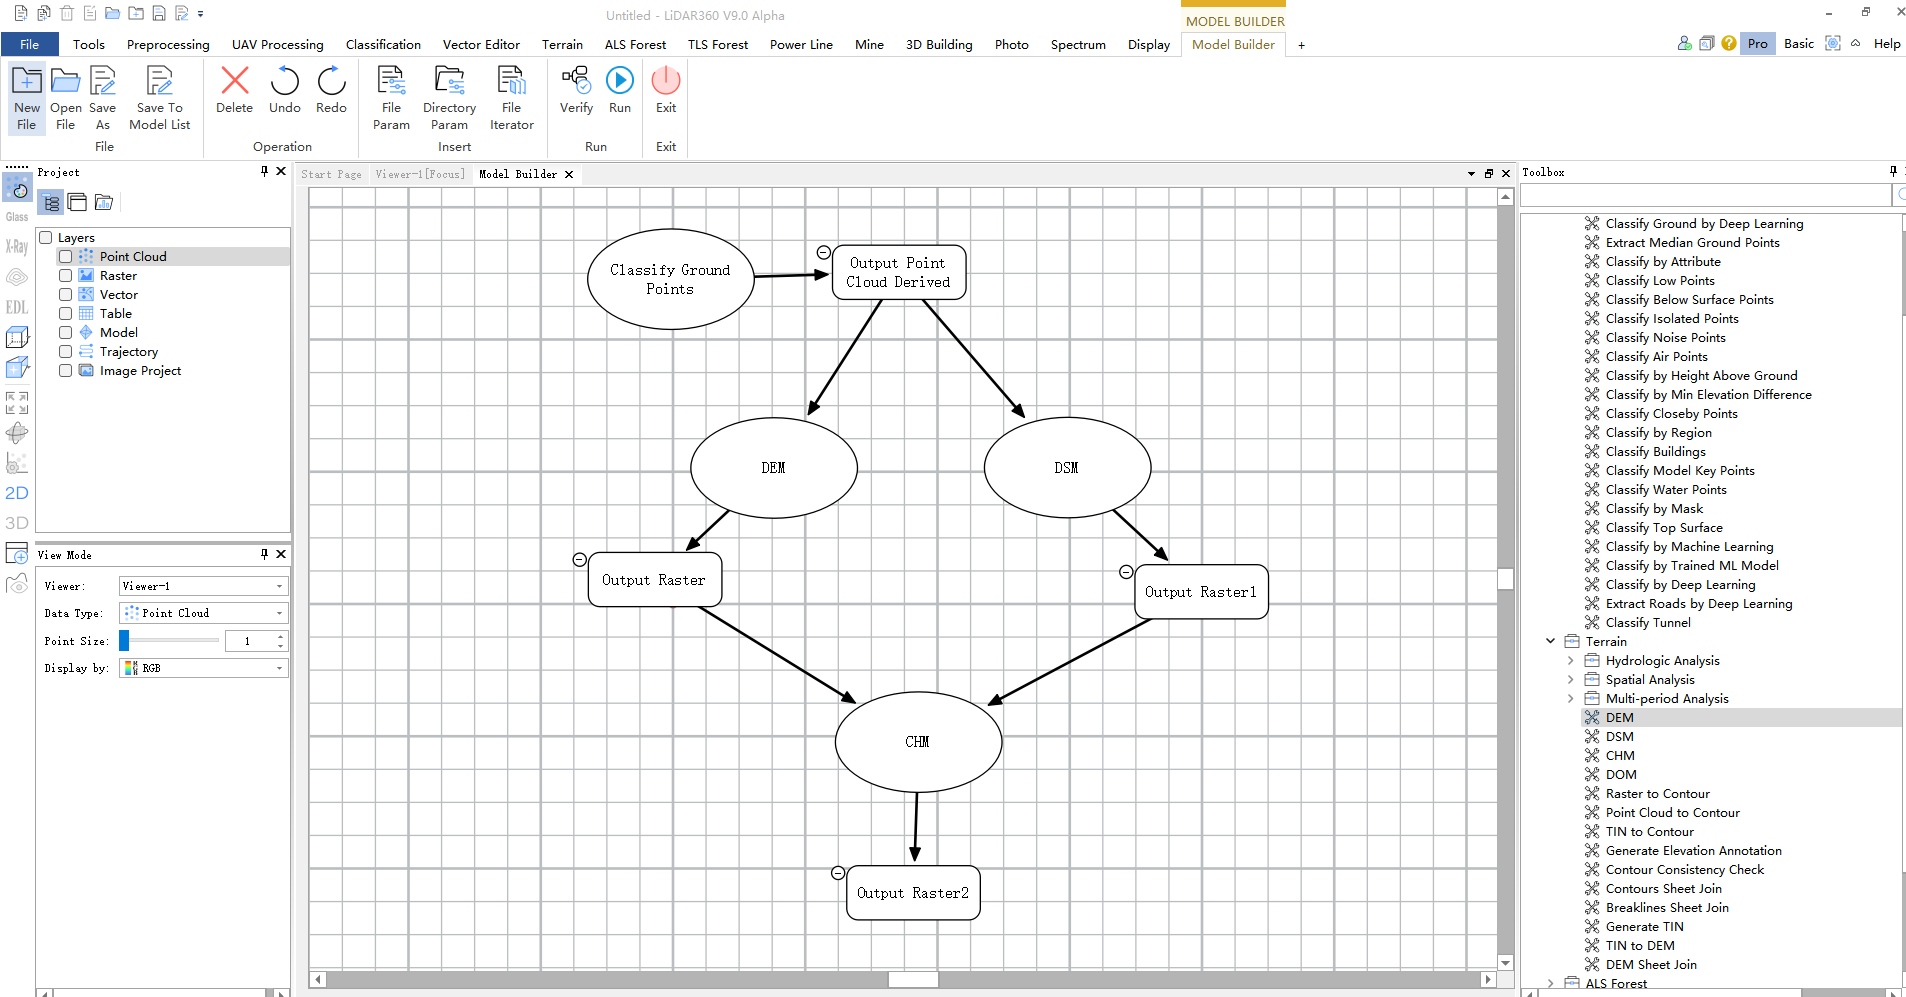
After all processing workflows are connected, the result is as follows:
4. Adding Data
There are two ways to add data:
- (1) Drag the required data from the left directory tree to the canvas.
- (2) Click the "Add File" or "Add Folder Parameter" button on the operation panel.
5. Connecting Data
After adding data to the canvas, connect it to the processing workflow. The connection operation is similar to the mouse operation described in step 3. After data connection, the result is as follows:
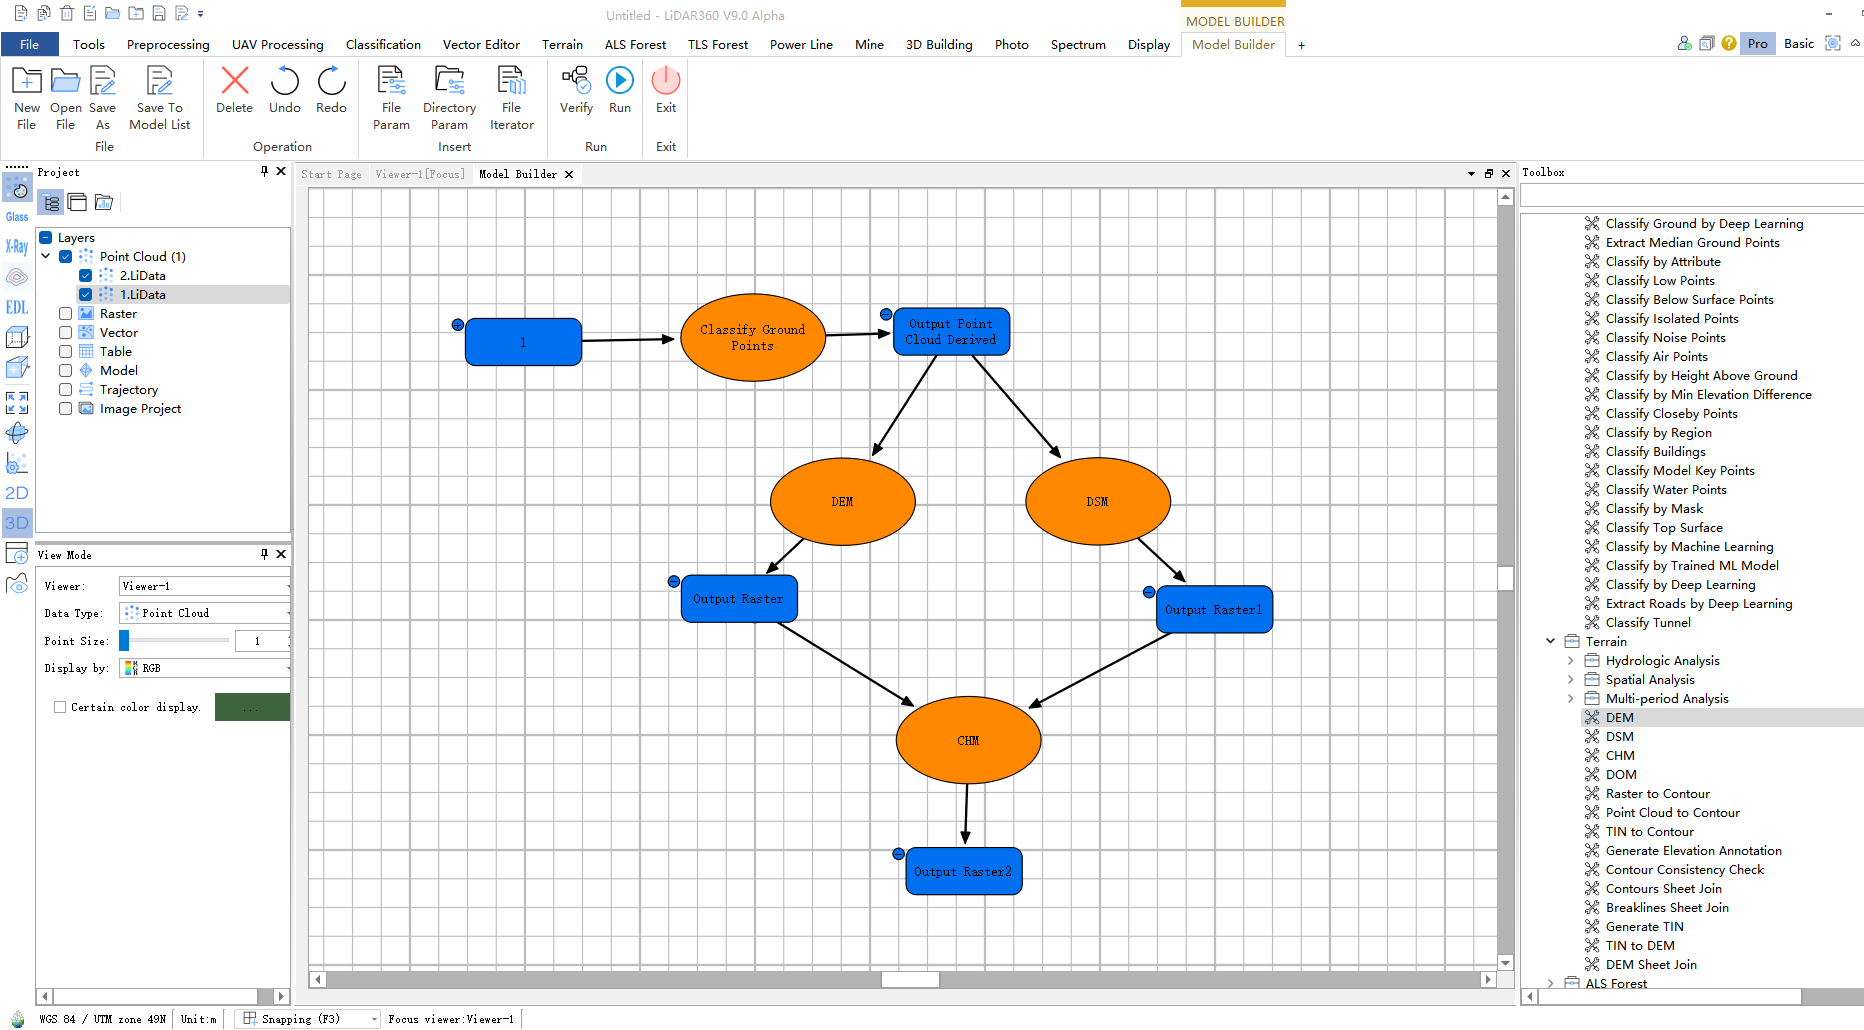
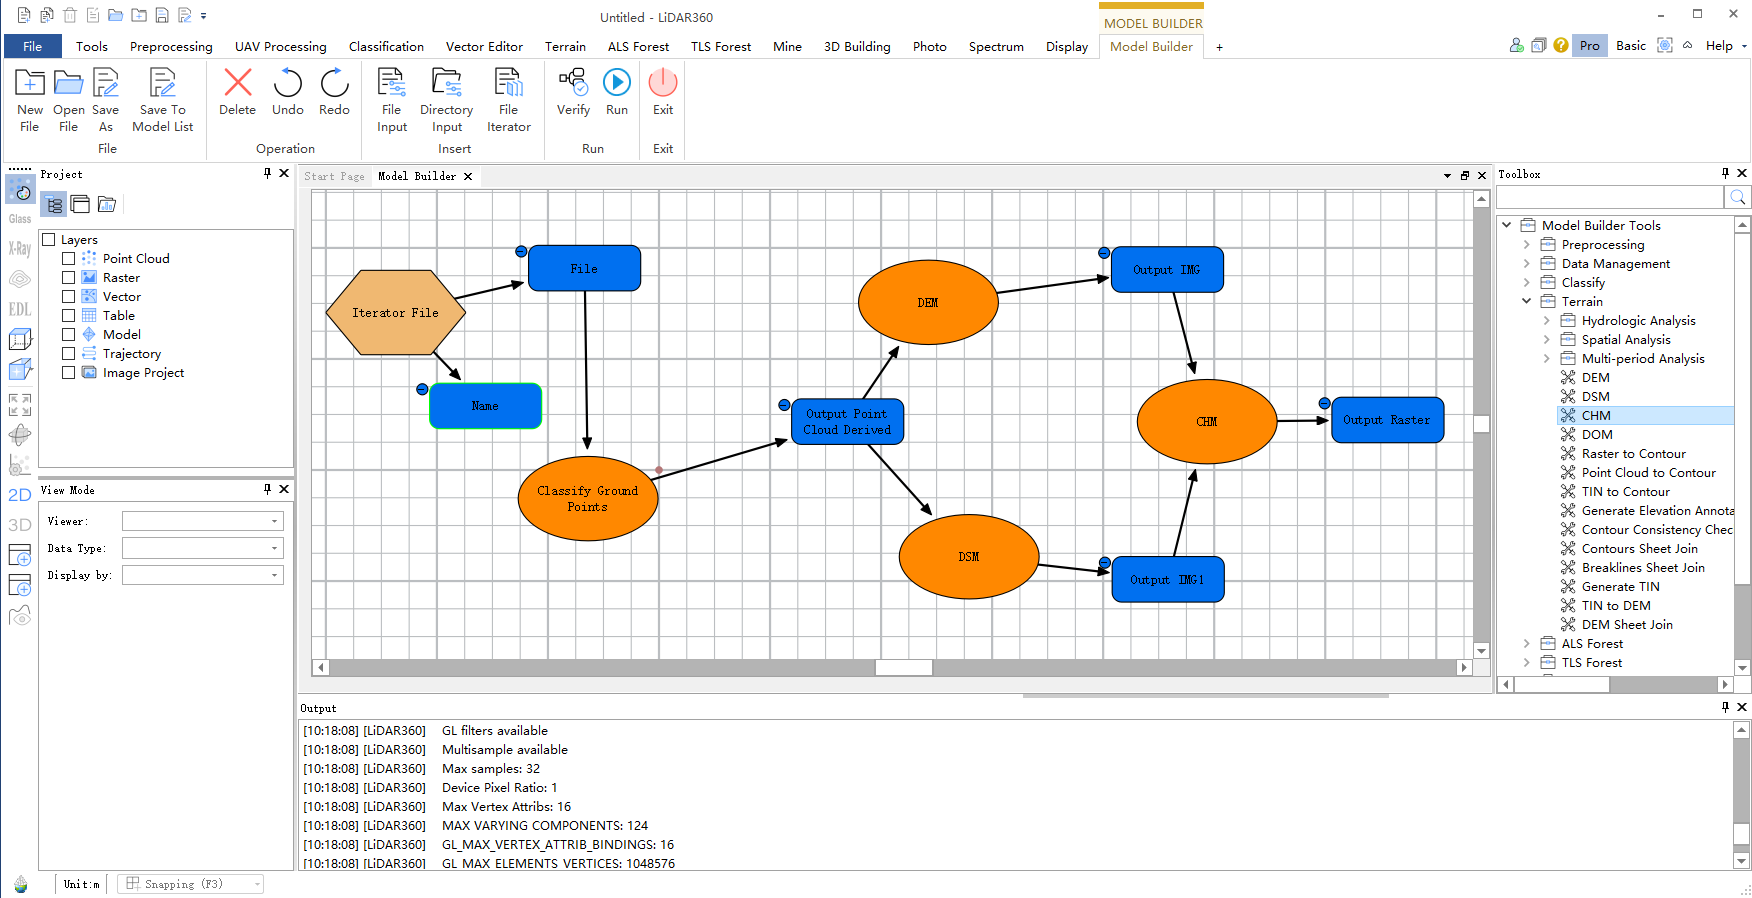
At this point, since the entire model has been built and connected to the required data, all tools and their input/output ports on the canvas change from white to active colors (tools turn orange, input/output ports turn blue).
7.File Iterator
File iterator can be used to connect multiple data to the processing workflow. It can specify multiple file lists as input, as shown in the figure below:
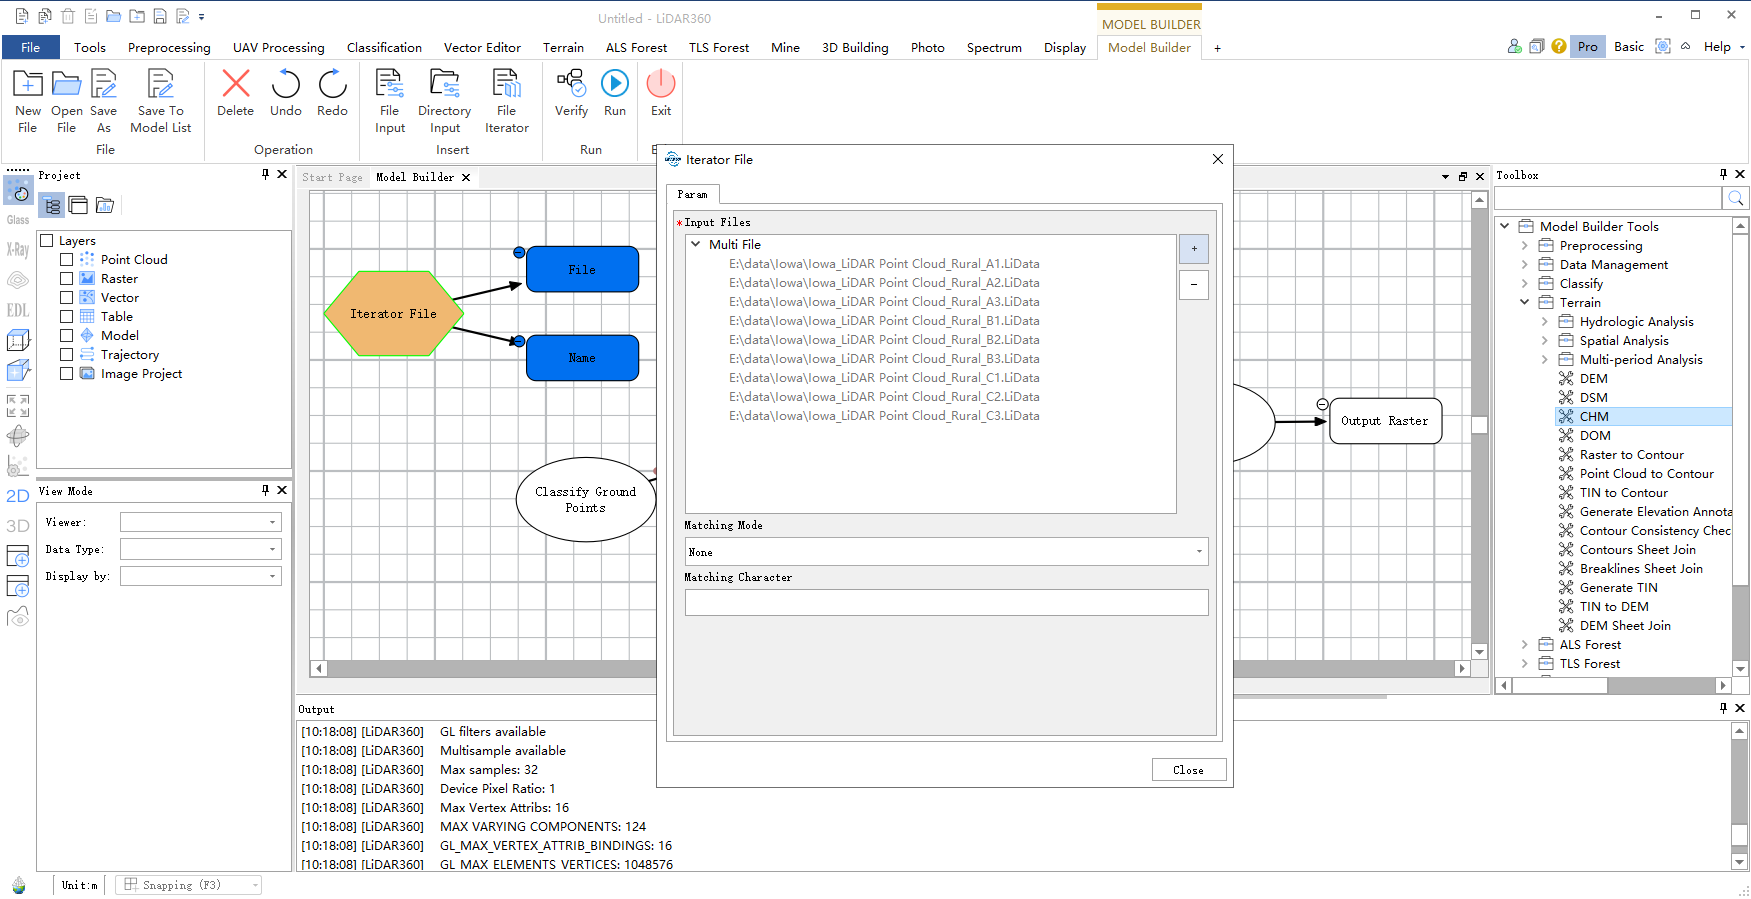
A file iterator can specify the input as a list of several files and then connect them to the process, as shown in the following figure:
8. Running the Model
Once all tools and their input/output ports on the canvas turn active colors, the model can be run. Click the "Run" button on the operation panel to run the model.
During model execution, running tools will blink continuously, successfully executed tools will turn green, and failed tools will turn reddish-brown.
9. Saving the Model
Successfully built models can be saved to a specified file for future reloading and reuse. Save the model using the "Save As" button on the operation panel.