Spectral Index Calculator
Function Overview
This function is based on the combination of surface reflectivity of two or more wavelengths to highlight the specific characteristics of the ground objects, and the function contains all spectral indices.
Usage
Click Spectrum > Spectral Index > Spectral Index Calculator.
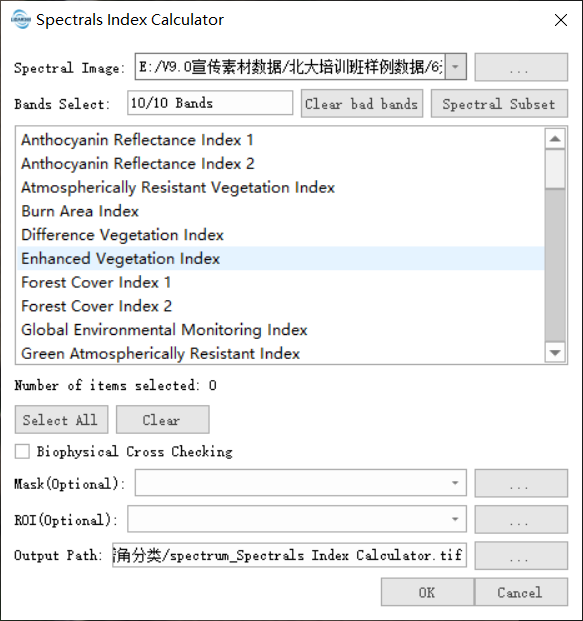
Click the Spectrum Subset button to select the band of the hyperspectral image, and the spectral index it supports to calculate will also change accordingly.

Parameter Setting
- Input hyperspectral image data: Input the hyperspectral image data file. The format supports tif, tiff, img, dat. The data must have wavelength information.
- Band Selection: Select the band of the hyperspectral image.
- Supported spectral index: Automatically match the calculated spectral index according to the wavelength information of the selected band.
- Biophysics Cross-test: The process of verifying the correlation between the spectral index and the actual biophysical parameters of the land objects to ensure the scientificity and reliability of the index results. It is not checked by default.
- ROI: After selection, only the minimum external rectangle in the ROI area is calculated exponentially.
- Mask: Only the effective area of the mask is calculated exponentially after selection.
- Output path: The generated tif path.
References
@inproceedings{ author={Gu, Z., et al}, title={Using Multiple Radiometric Correction Images to Estimate Leaf Area Index}, booktitle={International Journal of Remote Sensing 32 (2011):9441-9454}, year={2011} } @inproceedings{
author={Guyot, G., and G. Xing-Fa},
title={Effect of Radiometric Corrections on NDVI-Determined from SPOT-HRV and Landsat-TM Data},
booktitle={Remote Sensing of Environment 49, no. 3 (1994): 169-180},
year={1994}
}
    @inproceedings{
        author={Hadjimitsis, D., et al},
        title={Atmospheric Correction for Satellite Remotely Sensed Data Intended for Agricultural Applications: Impact on Vegetation Indices},
        booktitle={Natural Hazards Earth System Science 10 (2010): 89-95},
        year={2010}
    }
    @inproceedings{
        author={Jackson, R., and A. Huete},
        title={Interpreting Vegetation Indices},
        booktitle={Preventive Veterinary Medicine 11 (1991): 185-200},
        year={1991}
    }
    @inproceedings{
        author={Price, J},
        title={Calibration of Satellite Radiometers and the Comparison of Vegetation Indices},
        booktitle={Remote Sensing of Environment 21 (1987): 15-27},
        year={1987}
    }
    @inproceedings{
        author={Ray, T},
        title={A FAQ on Vegetation in Remote Sensing},
        booktitle={http://www.yale.edu/ceo/Documentation/rsvegfaq.html, updated 13 October 1994. Accessed February 2014},
        year={1994}
    }
    @inproceedings{
        author={Steven, M., et al},
        title={Intercalibration of Vegetation Indices from Different Sensor Systems},
        booktitle={Remote Sensing of Environment 88 (2003): 412-422},
        year={2003}
    }
Supported Index
| No. | Name | Abbreviation | Formula | Bands | Application Field | Meaning/Threshold |
|---|---|---|---|---|---|---|
| 1 | Alunite Index | ALUI | (w2260 w2165) / (w2260 w2330) | w2165, w2260, w2330 | Mineral exploration (alunite identification) | ALUI indicate s the mineral characteristics related to alunite. Threshold: >1.0 may indicate alunite. |
| 2 | Anthocyanin Reflectance Index 1 | ARI1 | (1.0 / w550) - (1.0 / w700) | w550, w700 | Vegetation physiology (anthocyanin content) | ARI1 is a vegetation index used to evaluate the content of anthocyanins in plant leaves. A higher ARI1 value indicate s the growth or death of vegetation canopy. Threshold: >0.001 indicate anthocyanin accumulation. |
| 3 | Anthocyanin Reflectance Index 2 | ARI2 | w800n * ((1.0 / w550) - (1.0 / w700)) | w800n, w550, w700 | Vegetation physiology (anthocyanin content) | ARI2 is an improvement of ARI1 and is more effective when anthocyanin concentrations are high. Threshold: >0 indicate anthocyanin accumulation. |
| 4 | Atmospherically Resistant Vegetation Index | ARVI | (w800w - 2w680 + w450) / (w800w + 2w680 - w450) | w800w, w680, w450 | Vegetation monitoring (atmospheric resistance) | ARVI is an improved vegetation index, which corrects atmospheric scattering effect by introducing blue band, reduces atmospheric interference, and is more suitable for monitoring vegetation health under complex atmospheric conditions. Threshold: >0.5 dense vegetation, 0.2 to 0.5 moderate, 0 to 0.2 sparse, <0 bare soil/water. |
| 5 | Burn Area Index | BAI | 1.0 / ((0.1 - red)^2 + (0.06 - nir)^2) | nir, red | Fire monitoring (burned-area mapping) | BAI highlights burned land in the red to near-infrared spectrum, by emphasizing the charcoal signal in post-fire images. It is computed from the spectral distance from each pixel to a reference spectral point. Threshold: >0 indicate s burned areas; burned areas are usually >10, and unburned areas are <0. |
| 6 | Calcite Index | CALI | (w2205 / w2330) * (w2395 / w2330) | w2205, w2330, w2395 | Mineral exploration (calcite identification) | CALI reflects the characteristics of calcite minerals. Threshold: >1.0 may indicate calcite. |
| 7 | Carbonate Index | CARI | w10600 / w11300 | w10600, w11300 | Mineral exploration (carbonate rock identification) | CARI indicate s the characteristics of carbonate minerals. Threshold: >1.0 may indicate carbonate rocks. |
| 8 | Carotenoid Reflectance Index 1 | CRI1 | (1.0 / w510) - (1.0 / w550) | w510, w550 | Vegetation physiology (carotenoids) | CRI1 is a vegetation index used to detect the carotenoid content in plant leaves. It is very sensitive to the change of carotenoid relative chlorophyll concentration, and a high CRI1 value means that the carotenoid content is more than the chlorophyll content. Threshold: >0 indicate stress. |
| 9 | Carotenoid Reflectance Index 2 | CRI2 | (1.0 / w510) - (1.0 / w700) | w510, w700 | Vegetation physiology (carotenoids) | CRI2 an improved version of CRI1, is more effective when carotenoid concentrations are high, and a high CRI2 value means that carotenoid content is higher than chlorophyll content. Threshold: >0 indicate stress. |
| 10 | Cellulose Absorption Index | CAI | 0.5*(w2000 + w2200) - w2100 | w2000, w2200, w2100 | Vegetation residue/soil organic matter | CAI is a vegetation index based on short-wave infrared band, which describes the depth of cellulose absorption characteristics by calculating the reflectance of a specific band, and is mainly used to evaluate the content of cellulose and lignin in vegetation. Threshold: >0.5 indicate residue cover. |
| 11 | Clay Alteration Index | CLAI | (w1650 + w2205) / w2165 | w1650, w2165, w2205 | Mineral exploration (clay alteration) | CLAI reflects the characteristics of clay-altered minerals. Threshold: >1.0 may indicate clay minerals. |
| 12 | Clay Minerals Ratio | CMR | tm5 / tm7 | tm5, tm7 | Geological survey (clay minerals) | CMR highlights hydrothermally altered rocks containing clay and alunite. Threshold: >1.0 indicate relatively high clay content. |
| 13 | Difference Vegetation Index | DVI | nir - red | nir, red | Vegetation monitoring (general) | DVI distinguishes between soil and vegetation, but it does not account for the difference between reflectance and radiance caused by atmospheric effects or shadows. Threshold: Values vary by sensor; no fixed threshold. |
| 14 | Disease Water Stress Index | DWSI | (nir + green) / (swir1 + red) | nir, green, swir1, red | Agriculture (disease/water stress) | DWSI detects water-stressed crops at a canopy level. Threshold: increases as stress increases, no uniform threshold. |
| 15 | Dolomite Index | DOLI | (w2205 + w2330) / w2300 | w2205, w2300, w2330 | Mineral exploration (dolomite identification) | DOLI is used to characterize the characteristics of dolomite minerals. Threshold: >1.0 may indicate dolomite. |
| 16 | Enhanced Vegetation Index | EVI | (2.5 (nir - red)) / (nir + 6.0red - 7.5*blue + 1.0) | nir, red, blue | Vegetation monitoring (high-biomass areas) | EVI is an improved vegetation index, which reduces atmospheric and soil interference by introducing atmospheric correction and soil background adjustment, and is more suitable for vegetation monitoring in high biomass areas. Threshold: >0.5 high cover, 0.2 to 0.5 moderate, <0.2 sparse vegetation/bare soil. |
| 17 | Epidote/Chlorite/Amphibole Index | ECAI | (w2205 + w2395) / (w2300 + w2330) | w2205, w2300, w2330, w2395 | Mineral exploration (epidote/chlorite/amphibole) | ECAI indicate s the mineral characteristics related to epidote, chlorite and amphibole. Threshold: >1.0 may indicate mineral assemblages. |
| 18 | Ferric Iron Alteration Index | FEAI | (w2165 / w820) + (w560 / tm3) | w560, tm3, w820, w2165 | Mineral exploration (ferric iron alteration) | FEAI reflects the characteristics of ferric iron-altered minerals. Threshold: >1.0 may indicate Fe3+ alteration. |
| 19 | Ferrous Iron (Fe²⁺) Index | FEI | (w2165 + w820) / (w560 + tm3) | w560, tm3, w820, w2165 | Mineral exploration (ferrous iron minerals) | FEI is used to indicate the characteristics of ferrous iron minerals. Threshold: >1.0 may indicate Fe2+ minerals. |
| 20 | Ferrous Minerals Ratio | FMR | tm5 / tm4 | tm5, tm4 | Mineral exploration (iron-bearing minerals) | FMR highlights iron-bearing minerals. Threshold: >1.0 indicate possible enrichment of iron-bearing minerals. |
| 21 | Ferrous Silicates Index | FESI | w2165 / w1650 | w1650, w2165 | Mineral exploration (ferrous silicates) | FESI reflects the characteristics of ferrous silicate minerals. Threshold: >1.0 indicate ferrous silicates. |
| 22 | Forest Cover Index 1 | FCI1 | red * rededge | red, rededge | Forestry (forest cover) | FCI1 distinguishes forest canopies from other types of vegetation using multispectral reflectance imagery that includes a red edge band. Threshold: proportional to canopy density. |
| 23 | Forest Cover Index 2 | FCI2 | red * nir | red, nir | Forestry (forest cover) | FCI2 distinguishes forest canopies from other types of vegetation using multispectral reflectance imagery that does not include a red edge band. Threshold: proportional to canopy density. |
| 24 | Global Environmental Monitoring Index | GEMI | η(1-0.25η)-(red-0.125)/(1-red) | red, nir | Global vegetation monitoring | GEMI a non-linear vegetation index, is used for global environmental monitoring from satellite imagery and attempts to correct for atmospheric effects. It is affected by bare soil. Threshold: >0.4 good vegetation cover. |
| 25 | Green Atmospherically Resistant Index | GARI | (nir - green + 1.7blue - 1.7red) / (nir + green - 1.7blue + 1.7red) | nir, red, green, blue | Vegetation monitoring (atmospheric resistance + green band) | GARI is more sensitive to a wide range of chlorophyll concentrations and less sensitive to atmospheric effects than NDVI. Threshold: >0.5 high vegetation, 0.2 to 0.5 moderate, <0.1 bare soil/water. |
| 26 | Green Chlorophyll Index | GCI | (nir / green) - 1.0 | nir, green | Agriculture (chlorophyll content) | GCI is used to estimate leaf chlorophyll content across a wide range of plant species. Threshold: >1.5 highchlorophyll, 1.0 to 1.5 moderate, <1.0 low. |
| 27 | Green Difference Vegetation Index | GDVI | nir - green | nir, green | Vegetation monitoring (green band) | GDVI was originally designed with color-infrared photography to predict nitrogen requirements for corn. Threshold: increases with vegetation cover. |
| 28 | Green Leaf Index | GLI | (2.0green - red - blue) / (2.0green + red + blue) | red, green, blue | Agriculture (green leaf cover) | GLI was originally designed for use with a digital RGB camera to measure wheat cover. Threshold: >0 green leaves, about 0 bare soil, <0 non-green. |
| 29 | Green Normalized Difference Vegetation Index | GNDVI | (nir - green) / (nir + green) | nir, green | Vegetation monitoring (green-band normalization) | GNDVI is similar to NDVI except that it measures the green spectrum from 540 to 570 nm instead of the red spectrum. It is more sensitive to chlorophyll concentration than NDVI. Threshold: >0.5 dense vegetation, 0.2 to 0.5 moderate, <0.2 sparse vegetation/bare soil. |
| 30 | Green Optimized Soil Adjusted Vegetation Index | GOSAVI | (nir - green) / (nir + green + 0.16) | nir, green | Agriculture (sparse vegetation) | GOSAVI was originally designed with color-infrared photography to predict nitrogen requirements for corn. It is similar to OSAVI, but it substitutes the green band for red. Threshold: >0.5 high cover, 0.2 to 0.5 moderate, <0.2 sparse. |
| 31 | Green Ratio Vegetation Index | GRVI | nir / green | nir, green | Vegetation monitoring (simple ratio) | GRVI is sensitive to photosynthetic rates in forest canopies, as green and red reflectances are strongly influenced by changes in leaf pigments. Threshold: >1.0 green vegetation, high vegetation cover may exceed 5. |
| 32 | Green Soil Adjusted Vegetation Index | GSAVI | 1.5 * (nir - green) / (nir + green + 0.5) | nir, green | Agriculture/ecology (soil adjustment) | GSAVI as originally designed with color-infrared photography to predict nitrogen requirements for corn. It is similar to SAVI, but it substitutes the green band for red. Threshold: >0.5 high cover. |
| 33 | Green Vegetation Index | GVI | -0.2848tm1 - 0.2435tm2 - 0.5436tm3 + 0.7243tm4 + 0.0840tm5 - 0.1800tm7 | tm1, tm2, tm3, tm4, tm5, tm7 | Geology/vegetation (K-T transform) | GVI minimizes the effects of background soil while emphasizing green vegetation. Threshold: positive values indicate vegetation; soil/water bodies are about 0 or negative. |
| 34 | Hydroxyl-Bearing Altered Minerals Index 1 | OHI1 | (w2260 / w2205) * (w1650 / w2205) | w1650, w2205, w2260 | Mineral exploration (hydroxyl alteration) | OHI1 indicate s the characteristics of hydroxyl-bearing altered minerals. Threshold: >1.0 may indicate hydroxyl alteration. |
| 35 | Hydroxyl-Bearing Altered Minerals Index 2 | OHI2 | (w1650 w2260) / (w2205 w2205) | w1650, w2205, w2260 | Mineral exploration (hydroxyl alteration) | OHI2 indicate s the characteristics of hydroxyl-bearing altered minerals. Threshold: >0 may indicate hydroxyl alteration. |
| 36 | Hydroxyl-Bearing Altered Minerals Index 3 | OHI3 | (w1650 w2260) / (w2165 w2165) | w1650, w2165, w2260 | Mineral exploration (hydroxyl alteration) | OHI3 indicate s the characteristics of hydroxyl-bearing altered minerals. Threshold: >0 may indicate hydroxyl alteration. |
| 37 | Infrared Percentage Vegetation Index | IPVI | nir / (nir + red) | nir, red | Vegetation monitoring (percentage form) | IPVI is functionally the same as NDVI, but it is computationally faster. Threshold: >0.5 vegetation dominant. |
| 38 | Iron Oxide Ratio | IOR | tm3 / tm1 | tm3, tm1 | Geological survey (iron oxides) | IOR highlights hydrothermally altered rocks that have been subjected to oxidation of iron-bearing sulphides. Threshold: >1.0 indicate iron oxide enrichment. |
| 39 | Kaolinite Index 1 | KAI1 | w2300 / w2165 | w2300, w2165 | Mineral exploration (kaolinite) | KAI1 reflects the characteristics of kaolinite minerals. Threshold: >1.0 may indicate kaolinite. |
| 40 | Kaolinite Index 2 | KAI2 | (w1650 / w2165) * (w2330 / w2205) | w1650, w2165, w2205, w2330 | Mineral exploration (kaolinite) | KAI2 is used to indicate the characteristics of kaolinite minerals. Threshold: >0.5 may indicate kaolinite. |
| 41 | Kaolinite Index 3 | KAI3 | (w1650 + w2260) / w2205 | w1650, w2205, w2260 | Mineral exploration (kaolinite) | KAI3 reflects the characteristics of kaolinite minerals. Threshold: >1.0 may indicate kaolinite. |
| 42 | Laterite Index | LATI | w1650 / w560 | w560, w1650 | Geology/soil (laterization) | LATI is used to indicate the mineral characteristics related to laterite. Threshold: >1.0 may indicate laterization. |
| 43 | Leaf Area Index | LAI | max(3.618(2.5(nir-red)/(1+nir+6red-7.5blue))-0.118, 0) | nir, red, blue | Agriculture/ecology (leaf area index) | LAI is used to estimate foliage cover and to forecast crop growth and yield. Threshold: <1 1="" 3="" sparse,="" to="" moderate,="">3 closed canopy, >7 rare. |
| 44 | Leaf Chlorophyll Index | LCI | (w850 - w710) / (w850 + w680) | w850, w710, w680 | Agriculture (leaf chlorophyll) | LCI is used to estimate chlorophyll content in higher plants, sensitive to variation in reflectance caused by chlorophyll absorption. Threshold: >0.5 high, 0.2 to 0.5 moderate, <0.2 low. |
| 45 | Leaf Water Vegetation Index 1 | LWVI1 | (w1094 - w983) / (w1094 + w983) | w1094, w983 | Vegetation water content (leaf water content) | LWVI1 estimates leaf water content, an NDWI variant. Threshold: >0 indicate s normal water status; about 0 or negative values indicate drought. |
| 46 | Leaf Water Vegetation Index 2 | LWVI2 | (w1094 - w1205) / (w1094 + w1205) | w1094, w1205 | Vegetation water content (leaf water content) | LWVI2 estimates leaf water content, an NDWI variant. Threshold: same as LWVI1. |
| 47 | Lignin Cellulose Absorption Index | LCAI | 100.0 * ((w2205 - w2165) + (w2205 - w2330)) | w2205, w2165, w2330 | Vegetation residue (lignin/cellulose) | LCAI estimates the relative content of lignin and cellulose in vegetation canopies by utilizing absorption features in SWIR bands. It is applicable for wildfire fuel analysis and crop residue monitoring. Threshold: >0 indicate dead vegetation/woody residue. |
| 48 | Magnesite Index | MAGI | (w2205 + w2330) / (w2260 + w2395) | w2205, w2260, w2330, w2395 | Mineral exploration (magnesite) | MAGI reflects the characteristics of magnesite minerals. Threshold: >1.0 may indicate magnesite. |
| 49 | MgOH-Carbonate Abundance Index | MGAI | (w2395 + w2205) / w2330 | w2205, w2330, w2395 | Mineral exploration (Mg-bearing carbonates) | MGAI is used to indicate the abundance characteristics of MgOH-carbonate. Threshold: >1.0 may indicate Mg-bearing carbonates. |
| 50 | Modified Chlorophyll Absorption Ratio Index | MCARI | ((w700 - w680) - 0.2(w700 - w550)) (w700 / w680) | w700, w680, w550 | Agriculture (chlorophyll absorption) | MCARI is a simplified version of CARI designed to minimize the combined effects of soil and non-photosynthetic surfaces. Threshold: >0 indicate chlorophyll, higher values indicate higher concentration. |
| 51 | Modified Chlorophyll Absorption Ratio Index - Improved | MCARI2 | (1.5(2.5(w800n-w680)-1.3(w800n-w550))) / sqrt((2w800n+1)^2-(6w800n-5sqrt(w680))-0.5) | w800n, w680, w550 | Agriculture (improved chlorophyll) | MCARI2 is considered a better predictor of LAI. It incorporates a soil adjustment factor while preserving sensitivity to LAI and resistance to chlorophyll influence. Threshold: >0.2 high, 0.1 to 0.2 moderate, <0.1 low. |
| 52 | Modified Non-Linear Index | MNLI | ((nir^2 - red) * 1.5) / (nir^2 + red + 0.5) | nir, red | Vegetation monitoring (nonlinear) | MNLI is an enhancement to the Non-Linear Index that incorporates the SAVI to account for the soil background. Threshold: >0.5 high cover, 0.2 to 0.5 moderate. |
| 53 | Modified Normalized Difference Water Index | MNDWI | (green - swir1) / (green + swir1) | green, swir1 | Water extraction/urban water systems | MNDWI enhances open water features while suppressing noise from built-up land, vegetation, and soil. It produces better results in enhancing and extracting water from a background that is dominated by build-up land areas. Threshold: >0 indicate s water bodies; usually >0.2 indicate s confirmed water bodies; buildings are <0. |
| 54 | Modified Red Edge Normalized Difference Vegetation Index | MRENDVI | (w750w - w705) / (w750w + w705 - 2.0*w445) | w750w, w705, w445 | Vegetation monitoring (red-edge improvement) | MRENDVI is sensitive to small changes in leaf canopy, forest window fragments and senescence, and can be used for fine agriculture, forest monitoring and vegetation stress detection. Threshold: >0.5 high, 0.2 to 0.5 moderate. |
| 55 | Modified Red Edge Simple Ratio | MRESR | (w750w - w445) / (w705 - w445) | w750w, w445, w705 | Vegetation monitoring (red-edge ratio) | MRESR is a vegetation index calculated using red-edge band and near-infrared band, which corrects the mirror reflection effect of leaves, and is particularly suitable for monitoring vegetation health and stress response. Threshold: >2.0 high health, <1.5 may stress. |
| 56 | Modified Simple Ratio | MSR | ((nir/red) - 1.0) / sqrt((nir/red) + 1.0) | nir, red | Vegetation monitoring (improved ratio) | MSR was developed an an improvement over RDVI by combining the Simple Ratio into the formula. The result is increased sensitivity to vegetation biophysical parameters. Threshold: >1.0 vegetation; high cover may exceed 5. |
| 57 | Modified Soil Adjusted Vegetation Index 2 | MSAVI2 | ((2nir+1) - sqrt((2nir+1)^2 - 8*(nir-red))) / 2 | nir, red | Arid-region vegetation (soil adjustment) | MSAVI2 is a simpler version of the MSAVI. It reduces soil noise and increases the dynamic range of the vegetation signal. Threshold: >0.5 good, 0.2 to 0.5 moderate, <0.2 sparse. |
| 58 | Modified Triangular Vegetation Index | MTVI | 1.2 (1.2(nir-green) - 2.5*(red-green)) | nir, red, green | Vegetation monitoring (triangular method) | MTVI improves the estimation accuracy of LAI by adjusting the wavelength to 800 nm. Threshold: >0.3 good. |
| 59 | Modified Triangular Vegetation Index - Improved | MTVI2 | (1.5(1.2(nir-green)-2.5(red-green))) / sqrt((2nir+1)^2-(6nir-5sqrt(red))-0.5) | nir, red, green | Vegetation monitoring (improved triangular method) | MTVI2 improves the prediction accuracy of LAI by introducing soil background correction based on MTVI. Threshold: >0.5 high, 0.2 to 0.5 moderate. |
| 60 | Moisture Stress Index | MSI | w1599 / w819 | w1599, w819 | Vegetation water stress | MSI is a vegetation index based on reflectance measurements that is very sensitive to changes in the water content of vegetation canopy. Threshold: >1.0 water stress, <1.0 sufficient water. |
| 61 | Montmorillonite Index | MONI | (w1650 + w2205) / w2260 | w1650, w2205, w2260 | Mineral exploration (montmorillonite) | MONI reflects the characteristics of montmorillonite minerals. Threshold: >1.0 may indicate montmorillonite. |
| 62 | Muscovite Index | MUSI | w2300 / w2205 | w2205, w2300 | Mineral exploration (muscovite) | MUSI is used to indicate the characteristics of muscovite minerals. Threshold: >1.0 may indicate muscovite. |
| 63 | Non-Linear Index | NLI | (nir^2 - red) / (nir^2 + red) | nir, red | Vegetation monitoring (nonlinear) | NLI assumes that the relationship between many vegetation indices and surface biophysical parameters is non-linear. It linearizes relationships with surface parameters that tend to be non-linear. Threshold: >0.5 high, 0.2 to 0.5 moderate. |
| 64 | Normalized Burn Ratio | NBR | (tm4 - tm7) / (tm4 + tm7) | tm4, tm7 | Fire monitoring (burn severity) | NBR highlights burned areas in large fire zones greater than 500 acres. The formula is similar to NDVI, except that it uses NIR and SWIR wavelengths. Threshold: healthy vegetation is >0.3; after burning <0.1; dnbr="">0.66 indicate s high severity. |
| 65 | Normalized Burn Ratio Thermal 1 | NBRT1 | (nir - (swir1(thermal/1000.0))) / (nir + (swir1(thermal/1000.0))) | nir, swir1, thermal | Fire monitoring (with thermal infrared) | NBRT1 uses a thermal band to enhance the NBR. It results in a better separability between burned and unburned land. Threshold: refer to NBR. |
| 66 | Normalized Difference Built-Up Index | NDBI | (tm5 - tm4) / (tm5 + tm4) | tm5, tm4 | Urban remote sensing (built-up land) | NDBI highlights urban areas where there is typically a higher reflectance in the SWIR region, compared to the NIR region. Applications include watershed runoff predictions and land-use planning. Threshold: >0 built-up areas, <0 vegetation;="" urban="" core="">0.1. |
| 67 | Normalized Difference Infrared Index | NDII | (w819 - w1649) / (w819 + w1649) | w819, w1649 | Vegetation water content (NIR-SWIR) | NDII is a remote sensing index used to monitor the water content of vegetation canopy. It reflects the water status of vegetation by calculating the difference and sum ratio of reflectance of short-wave infrared band and near-infrared band. Threshold: >0.3 sufficient water, 0 to 0.3 moderate, <0 stress. |
| 68 | Normalized Difference Lignin Index | NDLI | (log10(w1754) - log10(w1680)) / (log10(w1754) + log10(w1680)) | w1754, w1680 | Vegetation residue (lignin) | NDLI is a vegetation index used to evaluate the degree of aging and physiological stress of vegetation, mainly used to evaluate the lignin content in vegetation, especially suitable for monitoring the decomposition of vegetation litter and carbon cycle research. Threshold: >0 indicate s high lignin content. |
| 69 | Normalized Difference Moisture Index | NDMSI | (nir - swir1) / (nir + swir1) | nir, swir1 | Soil/vegetation moisture | NDMSI is used to determine vegetation water content. It is calculated as a ratio between the NIR and SWIR values in traditional fashion. Threshold: >0 sufficient water, <0 drought. |
| 70 | Normalized Difference Mud Index | NDMI | (w795 - w990) / (w795 + w990) | w795, w990 | Coast/tidal flats (sediment) | NDMI highlights muddy or shallow water pixels. It was originally designed as a filter to exclude those pixels and to improve the accuracy of QUick Atmospheric Correction (QUAC). Threshold: >0 indicate turbid water/mudflats. |
| 71 | Normalized Difference Nitrogen Index | NDNI | -(log10(w1680) - log10(w1510)) / (log10(w1510) + log10(w1680)) | w1510, w1680 | Agriculture (nitrogen content) | NDNI is a remote sensing index used to estimate the nitrogen content of vegetation. Based on the reflectance difference of short-wave infrared band, the nitrogen concentration of vegetation canopy is assessed, and it is highly sensitive to the change of nitrogen nutrient status of vegetation. Threshold: >0 indicate nitrogen-rich. |
| 72 | Normalized Difference Pond Index | NDPI | (swir1 - green) / (swir1 + green) | green, swir1 | Aquaculture/wetlands (aquaculture ponds) | NDPI helps differentiate between vegetation and ponds, and is targeted to add contrast when there is vegetation in ponds. Threshold: >0.1 possible aquaculture ponds; >0.2 confirmed water bodies. |
| 73 | Normalized Difference Snow Index | NDSI | (green - swir1) / (green + swir1) | green, swir1 | Snow and ice monitoring | NDSI highlights snow cover using a combination of visible (typically green) and shortwave-infrared wavelengths. Threshold: >0.4 snow/ice; 0.2 to 0.4 ice-water mixture; <0.2 non-snow. |
| 74 | Normalized Difference Vegetation Index | NDVI | (nir - red) / (nir + red) | nir, red | Vegetation monitoring (most commonly used) | NDVI is a remote sensing index that evaluates the vegetation status by analyzing the reflectance difference between near-infrared band and red band. Threshold: >0.6 dense vegetation; 0.2 to 0.6 moderate; 0 to 0.2 sparse; <0 water/bare soil. |
| 75 | Normalized Difference Water Index | NDWI | (w857 - midir) / (w857 + midir) | w857, midir | Water extraction/vegetation moisture | NDWI highlights water features by comparing reflectance of green and near-infrared bands, and is very sensitive to changes in canopy water content. Threshold: >0 water bodies/high water content; >0.2 clear water bodies; <0 vegetation/bare soil. |
| 76 | Normalized Multiband Drought Index | NMDI | (w860 - (w1640 - w2130)) / (w860 + (w1640 - w2130)) | w860, w1640, w2130 | Drought monitoring (multiband) | NMDI takes into account a soil moisture background to monitor potential drought conditions. It is commonly used in forest-fire detection. Threshold: >0.4 sufficient water, 0.2 to 0.4 moderate drought, <0.2 severe drought. |
| 77 | Normalized Pigment Chlorophyll Index | NPCI | (w680 - w430) / (w680 + w430) | w680, w430 | Agriculture (pigment-to-chlorophyll ratio) | NPCI assess the carotenoid to chlorophyll ratio at the leaf level. Threshold: >0.1 may indicate stress/senescence. |
| 78 | Optimized Soil Adjusted Vegetation Index | OSAVI | (nir - red) / (nir + red + 0.16) | nir, red | Agriculture (optimized soil adjustment) | OSAVI is based on SAVI. It uses a standard value of 0.16 for the canopy background adjustment factor. It is best used in areas with relatively sparse vegetation where soil is visible through the canopy. Threshold: >0.5 high cover, 0.16 to 0.5 moderate, <0.16 sparse vegetation/bare soil. |
| 79 | Phengitic Index | PHEI | w2165 / w2205 | w2165, w2205 | Mineral exploration (phengite) | PHEI reflects the characteristics of phengitic minerals. Threshold: >1.0 may indicate phengite. |
| 80 | Photochemical Reflectance Index | PRI | (w531 - w570) / (w531 + w570) | w531, w570 | Vegetation photosynthetic efficiency | PRI is a vegetation index based on photochemical reflection characteristics. By measuring the reflectance ratio of 531nm and 570nm bands, it evaluates the light energy utilization efficiency and photosynthetic status of vegetation, which is especially suitable for monitoring the photosynthetic stress and physiological changes of vegetation. Threshold: >0.02 high photosynthetic efficiency; <0 stress; commonly used for relative-change monitoring. |
| 81 | Phyllic Alteration Index | PHAI | (w2165 + w2260) / w2205 | w2165, w2205, w2260 | Mineral exploration (phyllic alteration) | PHAI reflects the characteristics of phyllic-altered minerals. Threshold: >1.0 may indicate phyllic alteration. |
| 82 | Plant Senescence Reflectance Index | PSRI | (w680 - w500) / w750w | w680, w500, w750w | Agriculture/ecology (vegetation senescence) | PSRI is a vegetation index used to evaluate the degree of aging and physiological stress of vegetation. By calculating the ratio of reflectance of red, blue and near-infrared bands, the sensitivity of carotenoid to chlorophyll ratio is improved, which is mainly used to evaluate the aging state and stress response of vegetation. Threshold: >0.5 obvious senescence/maturity; <0.2 healthy green vegetation. |
| 83 | Propylitic Alteration Index | PRAI | (w2260 + w2395) / w2330 | w2260, w2330, w2395 | Mineral exploration (propylitic alteration) | PRAI is used to indicate the characteristics of propylitic-altered minerals. Threshold: >1.0 may indicate propylitic alteration zone. |
| 84 | Quartz/Siliceous Rocks Index | QSRI | (w8650 w8650) / (w8300 w9100) | w8300, w8650, w9100 | Mineral exploration (quartz/siliceous rocks) | QSRI indicate s the mineral characteristics of quartz/siliceous rocks. Threshold: >1.0 may indicate quartz/siliceous rocks. |
| 85 | Quartz Rich Rocks Index | QRRI | w11300 / w9100 | w9100, w11300 | Mineral exploration (quartz-rich rocks) | QRRI reflects the mineral characteristics of quartz-rich rocks. Threshold: >1.0 may indicate quartz enrichment. |
| 86 | Red Edge Normalized Difference Vegetation Index | RENDVI | (w750n - w705) / (w750n + w705) | w750n, w705 | Precision agriculture (red-edge NDVI) | RENDVI is an improved version of NDVI, which is very sensitive to small changes of canopy, forest window fragments and aging, and is used for fine agriculture, forest monitoring, vegetation stress detection and so on. Threshold: >0.5 high, 0.3 to 0.5 moderate, <0.3 low. |
| 87 | Red Edge Position Index | REPI | (700+40*(((w670+w795)/2-rededge)/(w740-rededge)))/1000 | w670, w795, rededge, w740 | Vegetation physiology (red-edge position) | REPI is a vegetation index based on the change of red-edge band position. It can evaluate the chlorophyll content and physiological state of vegetation by analyzing the red-edge shift. It is especially suitable for monitoring vegetation stress and health status. Threshold: healthyabout 0.72μm; <0.715 indicate stress. |
| 88 | Red Green Ratio Index | RGRI | (sumred / sumgreen) * (nbandsgreen / nbandsred) | sumred, sumgreen, nbandsgreen, nbandsred | Vegetation/geology (red-green ratio) | RGRI is a vegetation index based on visible light band, which reflects the physiological state of vegetation by calculating the ratio of reflectance between red and green wavelengths. Threshold: >1 indicate dominance by iron oxides or yellowing vegetation. |
| 89 | Renormalized Difference Vegetation Index | RDVI | (nir - red) / sqrt(nir + red) | nir, red | Vegetation monitoring (renormalized) | RDVI uses the difference between near-infrared and red wavelengths, along with NDVI, to highlight healthy vegetation. It is insensitive to the effects of soil and sun viewing geometry. Threshold: >0.5 high, 0.2 to 0.5 moderate. |
| 90 | Silica Dioxide Index | SIDI | w9100 / w10600 | w9100, w10600 | Mineral exploration (silica dioxide) | SIDI reflects the mineral characteristics related to silica dioxide. Threshold: >1.0 may indicate siliceous rock/acidic rock. |
| 91 | Simple Ratio | SR | nir / red | nir, red | Vegetation monitoring (simple ratio) | SR is a simple vegetation index that evaluates vegetation cover and biomass by calculating the ratio of near-infrared to red wavelengths. Threshold: >2.0 dense vegetation, 1.0 to 2.0 moderate, <1.0 sparse/non-vegetation. |
| 92 | Simple Water Index | SWI | 1.0 / sqrt(blue - swir1) | blue, swir1 | Water extraction (simplified) | SWI is using statistical analysis to delineate water from shadows and built-up areas. Threshold: >0.5 may indicate clean water bodies. |
| 93 | Soil Adjusted Vegetation Index | SAVI | 1.5 * (nir - red) / (nir + red + 0.5) | nir, red | Arid-region vegetation (soil adjustment) | SAVI uses a canopy background adjustment factor L on the base of NDVI, it suppresses the effects of soil pixels. It is best used in areas with relatively sparse vegetation where soil is visible through the canopy. Threshold: >0.5 high cover, 0.2 to 0.5 moderate, <0.2 sparse vegetation/bare soil. |
| 94 | Structure Independent Pigment Index | SIPI | (w800n - w445) / (w800n - w680) | w800n, w445, w680 | Vegetation physiology (pigments) | SIPI1 is a spectral index used to evaluate the proportion of vegetation pigments (such as chlorophyll and carotenoids), which is characterized by its insensitivity to changes in leaf structure and is suitable for vegetation monitoring with different canopy structures. Threshold: >1.0 stress/senescence; <1.0 healthy. |
| 95 | Structure Insensitive Pigment Index | SIPI | (w800n - w445) / (w800n - w680) | w800n, w445, w680 | Vegetation physiology (pigments) | SIPI is an index used to evaluate the pigment content of vegetation. By calculating the reflectance ratio of near infrared band, blue band and red band, SIPI can reduce the influence of canopy structure on pigment monitoring, and can effectively indicate the change of the ratio of carotenoids to chlorophyll. Threshold: >1.0 stress/senescence; <1.0 healthy. |
| 96 | Sulfate Index | SULI | (w8300 w9100) / (w8650 w8650) | w8300, w8650, w9100 | Mineral exploration (sulfates) | SULI is used to indicate the characteristics of sulfate minerals. Threshold: >1.0 may indicate sulfate minerals. |
| 97 | Sum Green Index | SGI | sumgreen / nbandsgreen | sumgreen, nbandsgreen | Vegetation monitoring (green-band sum) | SGI is a simple vegetation index used to detect the change of green vegetation, which reflects the light scattering characteristics of vegetation canopy by calculating the average reflectance in the range of 500 nm to 600 nm, and is very sensitive to small changes in sparse vegetation. Threshold: proportional to green cover. |
| 98 | Transformed Chlorophyll Absorption Reflectance Index | TCARI | 3.0 ((w700 - w680) - 0.2 (w700 - w550) * (w700 / w680)) | w550, w680, w700 | Precision agriculture (chlorophyll) | TCARI is one of several CARI indices that indicate s the relative abundance of chlorophyll. It is affected by the underlying soil reflectance, particularly in vegetation with a low LAI. Threshold: >0.1 highchlorophyll; TCARI/OSAVI>0.7 highchlorophyll. |
| 99 | Transformed Difference Vegetation Index | TDVI | sqrt(0.5 + (nir - red) / (nir + red)) | nir, red | Urban vegetation (transformed DVI) | TDVI is useful for monitoring vegetation cover in urban environments. It does not saturate like NDVI and SAVI. Threshold: >0.5 high, 0.2 to 0.5 moderate. |
| 100 | Triangular Greenness Index | TGI | ((centerred-centerblue)(red-green) - (centerred-centergreen)(red-blue)) / -2.0 | centerred, centergreen, centerblue, red, green, blue | Vegetation physiology (chlorophyll) | TGI approximates the area of a triangle bounding a leaf reflectance spectrum, where the vertices are in the red, green, and blue wavelengths. Threshold: >0 indicate s chlorophyll presence; negative values indicate non-vegetation. |
| 101 | Triangular Vegetation Index | TVI | 0.5 (120.0(w750w-w550) - 200.0*(w680-w550)) | w550, w680, w750w | Vegetation monitoring (triangular method) | TVI estimates leaf area index (LAI) by calculating the triangular area of vegetation spectral characteristics, making it applicable for LAI estimation. Threshold: >10 healthy, 5 to 10 moderate, <5 sparse/stressed. |
| 102 | Visible Atmospherically Resistant Index | VARI | (green - red) / (green + red - blue) | red, green, blue | Vegetation monitoring (visible light) | VARI is based on ARVI and is used to estimate the fraction of vegetation in a scene with low sensitivity to atmospheric effects. Threshold: >0 indicate s vegetation; <0 indicate="" s="" non-vegetation;="">0.1 indicate s obvious green vegetation. |
| 103 | Vogelmann Red Edge Index 1 | VREI1 | w740 / w720 | w740, w720 | Vegetation stress (red edge) | VREI1 is a red-edge band based vegetation index that is highly sensitive to the synthesis of chlorophyll concentration, canopy and water content, and can be applied to the study of plant phenological changes, precision agriculture and vegetation productivity modeling. Threshold: >1.5 healthy, <1.0 may stress. |
| 104 | Vogelmann Red Edge Index 2 | VREI2 | (w734 - w747) / (w715w + w726) | w734, w747, w715w, w726 | Vegetation stress (red edge) | VREI2 is an improved red-edge band vegetation index, which can further enhance the sensitivity of vegetation chlorophyll content and physiological state by optimizing the band combination, and is suitable for accurate monitoring of vegetation health and stress response. Threshold: >0 indicate s healthy vegetation; negative values indicate stress. |
| 105 | Water Band Index | WBI | w970 / w900 | w970, w900 | Vegetation water content (water absorption band) | WBI reflects the water state of vegetation by calculating the ratio of reflectance between 970 nm and 900 nm bands, and is very sensitive to changes in canopy water state. Threshold: >0.95 sufficient water, <0.9 may stress. |
| 106 | Water Ratio Index | WRI | (green + red) / (nir + swir1) | green, red, nir, swir1 | Water/wetland (water ratio) | WRI can be used to determine the amount of moisture in vegetation. The calculation technique of this index is based on the ratio between the full spectral index of two visible light ranges (green and red) and shortwave and mid-wave infrared ranges. Threshold: >1.0 indicate open water/wetland. |
| 107 | Wide Dynamic Range Vegetation Index | WDRVI | (0.2nir - red) / (0.2nir + red) | nir, red | Vegetation monitoring (wide dynamic range) | WDRVI is similar to NDVI, but it uses a weighting coefficient (a) to reduce the disparity between the contributions of the near-infrared and red signals to the NDVI. It is particularly effective in scenes that have moderate-to-high vegetation density. Threshold: >0.2 high cover, 0 to 0.2 moderate, <0 non-vegetation. |
| 108 | WorldView Built-Up Index | WV-BI | (wv2coastal - wv2rededge) / (wv2coastal + wv2rededge) | wv2coastal, wv2rededge | Urban remote sensing (WorldView buildings) | WV-BI uses WorldView-2 bands to compute a Normalized Difference Built-Up Index (NDBI). Threshold: >0 indicate built-up areas. |
| 109 | WorldView Improved Vegetative Index | WV-VI | (wv2nir2 - wv2redcenter) / (wv2nir2 + wv2redcenter) | wv2nir2, wv2redcenter | Vegetation monitoring (WorldView improvement) | WV-VI uses WorldView-2 bands to compute NDVI. Threshold: >0.3 highvegetation cover. |
| 110 | WorldView New Iron Index | WV-II | (wv2green wv2yellow) / (wv2blue 1000.0) | wv2green, wv2yellow, wv2blue | Mineral exploration (WorldView iron index) | WV-II uses WorldView-2 bands to identify pixels rich in iron oxide. Threshold: >0.001 may indicate iron minerals. |
| 111 | WorldView Non-Homogeneous Feature Difference | WV-NHFD | (wv2rededge - wv2coastal) / (wv2rededge + wv2coastal) | wv2rededge, wv2coastal | Urban/land use (heterogeneity) | WV-NHFD uses WorldView-2 bands to identify features that contrast highly against the background. Examples include roofs, vehicles, and paved surfaces. Threshold: >0 high heterogeneity, <0 homogeneous. |
| 112 | WorldView Soil Index | WV-SI | (wv2green - wv2yellow) / (wv2green + wv2yellow) | wv2green, wv2yellow | Soil monitoring (WorldView soil) | WV-SI uses WorldView-2 bands to identify pixels that primarily consist of soil. Threshold: >0 indicate bare soil. |
| 113 | WorldView Water Index | WV-WI | (wv2coastal - wv2nir2) / (wv2coastal + wv2nir2) | wv2coastal, wv2nir2 | Water extraction (WorldView water bodies) | WV-WI uses WorldView-2 bands to highlight areas of standing water greater than one pixel in size. Threshold: >0 indicate water bodies. |