Canopy Cover
Functional Description
Canopy cover, also known as "vegetation coverage", refers to the percentage of the vertical projection area of vegetation on the ground to the total area of the statistical area. Canopy Cover is an important index to measure the status of surface vegetation, an important basic data to describe the ecosystem, and an important indicator of environmental changes in regional ecosystems, which is of great significance to the hydrology, ecology and regional changes and other studies.
Principle Description
For each statistical unit, the 3D volume column is first constructed based on the set grid spacing. Then, on the basis of the constructed body columns, count the total number of columns and the number of columns containing laser points with a height greater than a certain threshold, and calculate the canopy cover.
Among them,![]() </img> is the coverage rate,
</img> is the coverage rate, ![]() is the number of columns in which the height of the highest point cloud is higher than a threshold, and
is the number of columns in which the height of the highest point cloud is higher than a threshold, and ![]() is the total number of columns.
is the total number of columns.
Usage
Click TLS forest > Canopy Cover to generate the canopy cover tif file.
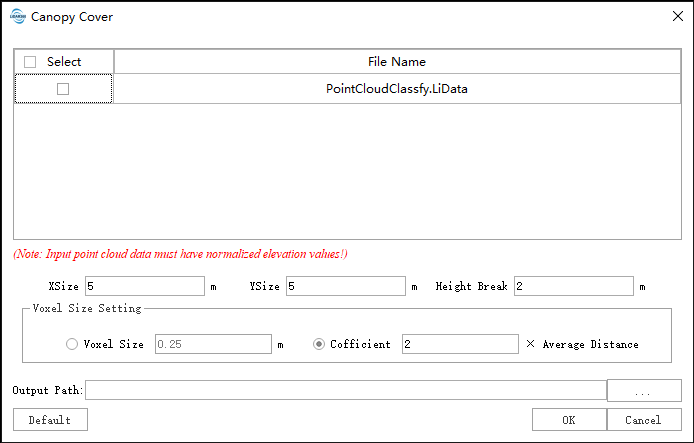
Parameters Settings
- Input data: Ensure that each input point cloud data is normalized; the input file can be a single data file or a point cloud data set; the file(s) to be processed must be opened in the LiDAR360 software.
- X Grid Size (meter) (default value: "5"): For the data acquired from most of the forest, this value should be larger than 5.
- Y Grid Size (meter) (default value: "5"): For the data acquired from most of the forest, this value should be larger than 5.
- Height Break (meter) (default value: "2"): The key parameter of coverage, only points in the column with a height greater than this value are considered to be covered by vegetation.
- Grid Settings:
- Grid Size (meter) (default value: "0.25"): Count the grid size of the point cloud in the cell into 3D grids.
- Coefficient (default value: "2"): According to the average spacing of the point cloud, the coefficient factor of the 3D mesh size in the statistical unit is automatically calculated.
- Output Path: The output path of a corresponding TIFF file which is generated by each input point cloud data after running.
Note: If the maximum Z value of the point cloud is greater than 200 or the maximum Z minus the minimum Z is greater than 200, the data is considered to be unnormalized, and the software will pop up the prompt message shown in the figure below, click "YES", this type of data Still participating in the calculation, click "NO", this type of data will not participate in the calculation, and the user can re-select the data that meets the conditions.