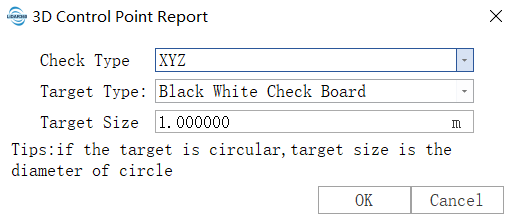
3D Control Point Report
Function Overview
Two methods are available for checks: Elevation and XYZ.
By selecting Elevation, the control point report tool will generate an elevation difference report between the LiDAR point cloud and ground control points. This can be used to check the elevation accuracy of the LiDAR point cloud and improve it using calculated correction values. The output report shows information about the elevation difference between the LiDAR point cloud and elevation control points, with statistical details such as the average elevation difference, root mean square error (RMSE), mean square error (MSE), average elevation difference, and the maximum and minimum elevation differences.
By selecting XYZ, the control point report tool calculates both the elevation and horizontal difference based on the identified target position information. It creates a report detailing the elevation and horizontal differences between the LiDAR point cloud and ground control points. This can be used to check both the elevation and horizontal accuracy of the LiDAR point cloud data. The output report includes information on the elevation and horizontal differences between the LiDAR point cloud and elevation control points, as well as statistics like average difference, RMSE, MSE, average elevation difference, and maximum and minimum values.
Target: A special marker with a specific pattern and shape placed on the ground, usually in featureless areas, used for precision checks of LiDAR and aerial photography control. Targets can be automatically recognized in point clouds or images to retrieve the 3D coordinates or pixel coordinates of their marked points, reducing manual operations.
Types of Targets
Supports four types of targets:
Square Black-and-White Checkerboard: A square black-and-white checkerboard pattern with the target location at the center.
Circular Black-and-White Checkerboard: A circular black-and-white checkerboard pattern with the target location at the center of the circle.
Two-Layer Concentric Circle: Composed of two concentric black-and-white circles, with the outer circle being black and the inner circle white. The radius of the outer circle is twice that of the inner circle, with the target location at the center of the circles.
Three-Layer Concentric Circle: Composed of three concentric black-and-white circles. The outer circle is black, the middle circle is white, and the innermost circle is black. The outer circle’s radius is three times the inner circle's, with the middle circle’s radius being twice the inner circle's, and the target location at the center of the circles.
Target Recognition: Uses an image template matching algorithm to identify and match patterns at different angles and scales. If the correlation coefficient exceeds the specified threshold, the recognition is successful. To improve efficiency, an approximate location must be given, and the search is conducted around this location. If the target’s location deviates too much from the given location, the search will fail. Usually, the control point’s location is provided as the approximate position. The target recognition requires the target type and approximate size parameters. The size parameters should be no less than 50% and no more than 200% of the actual size, as large differences in size may cause recognition failures.
Target Material and Size: For effective target recognition, the target should have high contrast and be clearly visible in the point cloud intensity map or image. The accuracy of target recognition depends on the contrast, clarity, and size of the target. The target size should be related to the LiDAR point density or image resolution, typically not less than 0.5m.
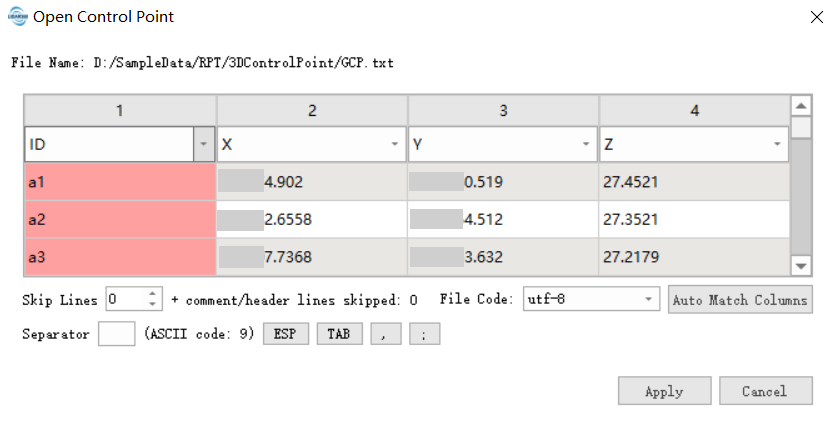
The control point file is a text file separated by commas, spaces, or other delimiters. Each line must contain X, Y, Z information, and at least three control points are required to successfully generate the control point report.
Usage
Click Preprocessing > 3D Control Point Report
Select the elevation check method when only control points are available. If targets are placed, the XYZ check method can be selected.
Check Type Elevation
Import Control Point File: Choose the ASCII format control point file path, and a control point file reading settings dialog will pop up. Set the column numbers for X, Y, Z and the row skip number, then click apply.
Export Control Point Report: After calculating the control point report, you can export the elevation difference report, which contains information about the corresponding points (i.e., points where Dz is not null), including X, Y, Z, T_Z, Dz, and Z statistics.
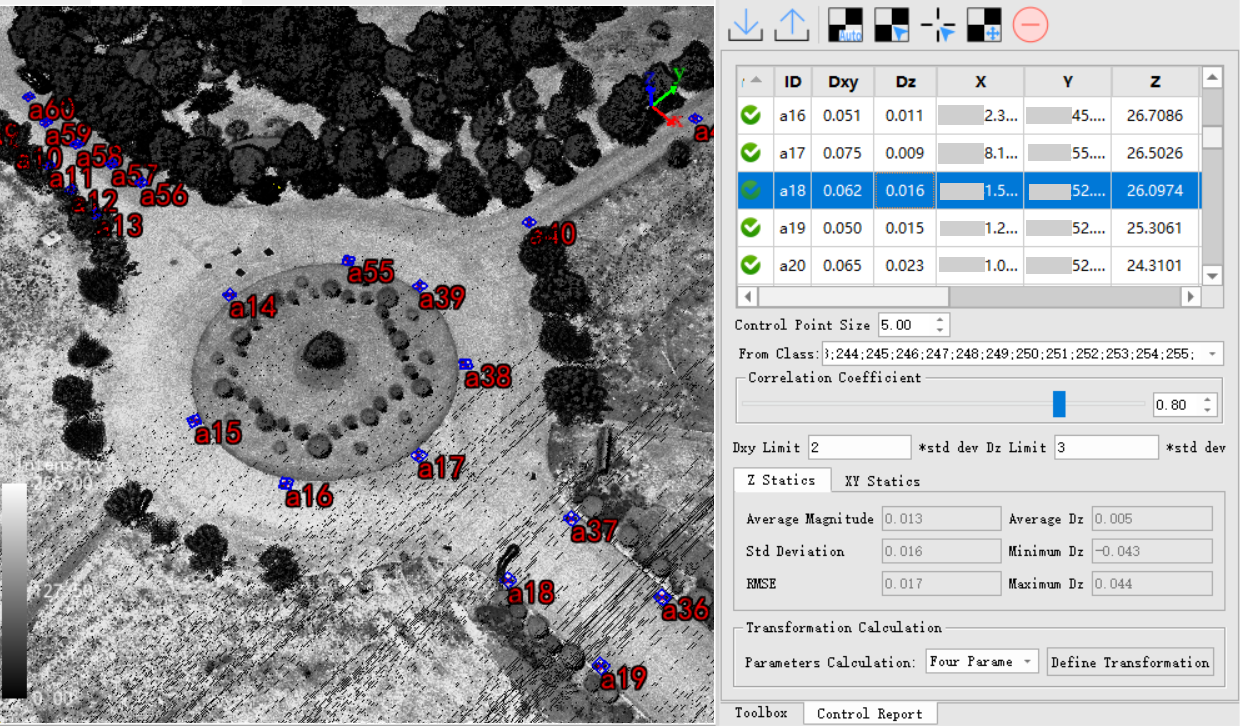
Calculate: Click this button to calculate the elevation difference between the LiDAR point cloud and ground control points. After calculation, double-click any position in the control point’s row to jump to the location of the control point.
As shown in the figure below, after calculation is completed, the status within the error range is displayed as ![]() ;
;
The status outside the error range is displayed as ![]() ;
;
If no corresponding point is found, the status is displayed as ![]() . Points with large errors can be deleted according to the actual situation. After calculation is completed, you can select the corresponding control points or modify the maximum slope and maximum triangle side length, then click the "Calculate" button to perform the calculation again.
. Points with large errors can be deleted according to the actual situation. After calculation is completed, you can select the corresponding control points or modify the maximum slope and maximum triangle side length, then click the "Calculate" button to perform the calculation again.
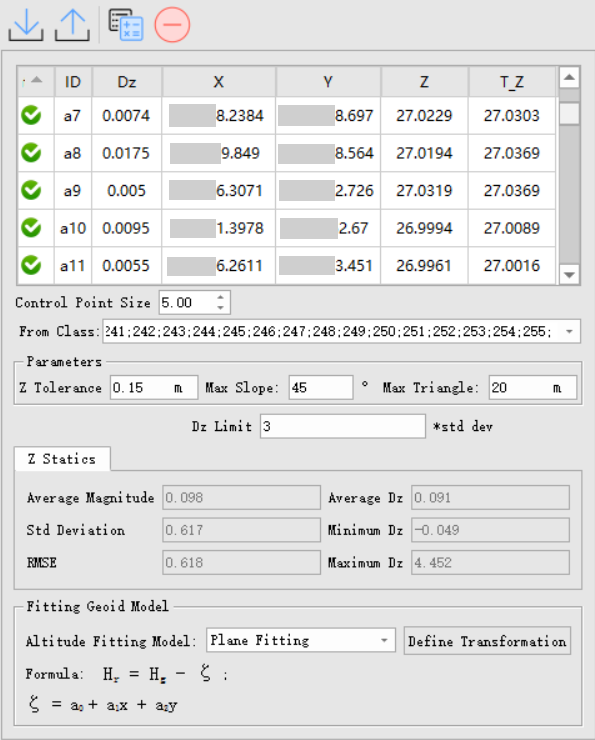
Delete: After reviewing the calculated control point table, if the status is marked as ![]() , it indicates a large error. Select the corresponding row and click this button to delete the erroneous data.
, it indicates a large error. Select the corresponding row and click this button to delete the erroneous data.
Parameter Settings
- Input Point Cloud Data: The input file can be a single point cloud data file or a point cloud dataset.
- From Class (default All): Select the point cloud category to use for checking elevation accuracy, usually hard-surface point clouds, such as ground points and building points.
- Z Tolerance (default "0.15"): The precision of the point cloud in the Z-direction to avoid overly small distances between points causing excessive slopes.
- Maximum Slope (degrees, default "45"): Maximum terrain slope tolerance. If the slope exceeds this value, the elevation difference will not be calculated. Typically, control points are placed in relatively flat areas, so if the slope is too large, it could introduce errors.
- Maximum Triangle (meters, default "20"): The maximum length of triangles to avoid large errors caused by elevation interpolation. If the edge length is too large, it means the initial category points in the control point’s corresponding area are too few, leading to large elevation errors.
- Known Points: Input control point file.
- Control Point Size (default "5"): The point size displayed in the control point report list. Double-click the data to locate the corresponding control point in the window.
- Dz Limit (default "3"): This sets the tolerance for Dz. If the difference is outside this range, it will be highlighted in red to detect large elevation differences between the LiDAR point cloud and control points. Maximum tolerance = mean elevation difference + Dz limit × RMSE; minimum tolerance = mean elevation difference - Dz limit × RMSE.
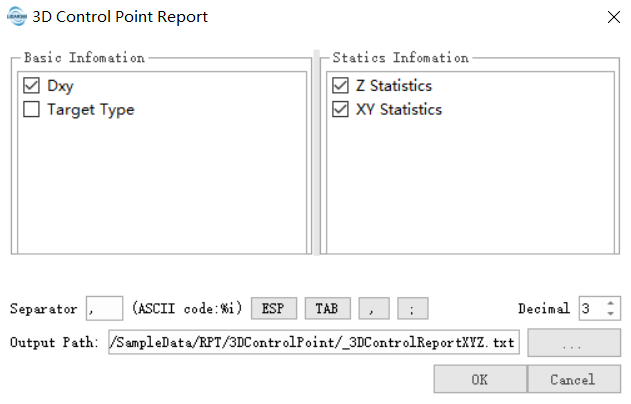
- Export Separator: Set the separator for the exported control point report, including options like semicolon, comma, etc.
- Calculate: After setting the parameters, click this button to calculate the elevation difference.
- Export: Export the control point report in TXT format. The report will include the elevation error information of the point cloud data and Dz statistics, with the relevant control point information separated by the chosen delimiter.
Check Type XYZ
Import Control Point File: Choose the path for the ASCII format control point file. A control point file reading settings dialog will pop up where you can set the column numbers for X, Y, Z and the row skip number. Refer to [Open File](../ProjectTools/AddData.md). After selecting, click Apply.
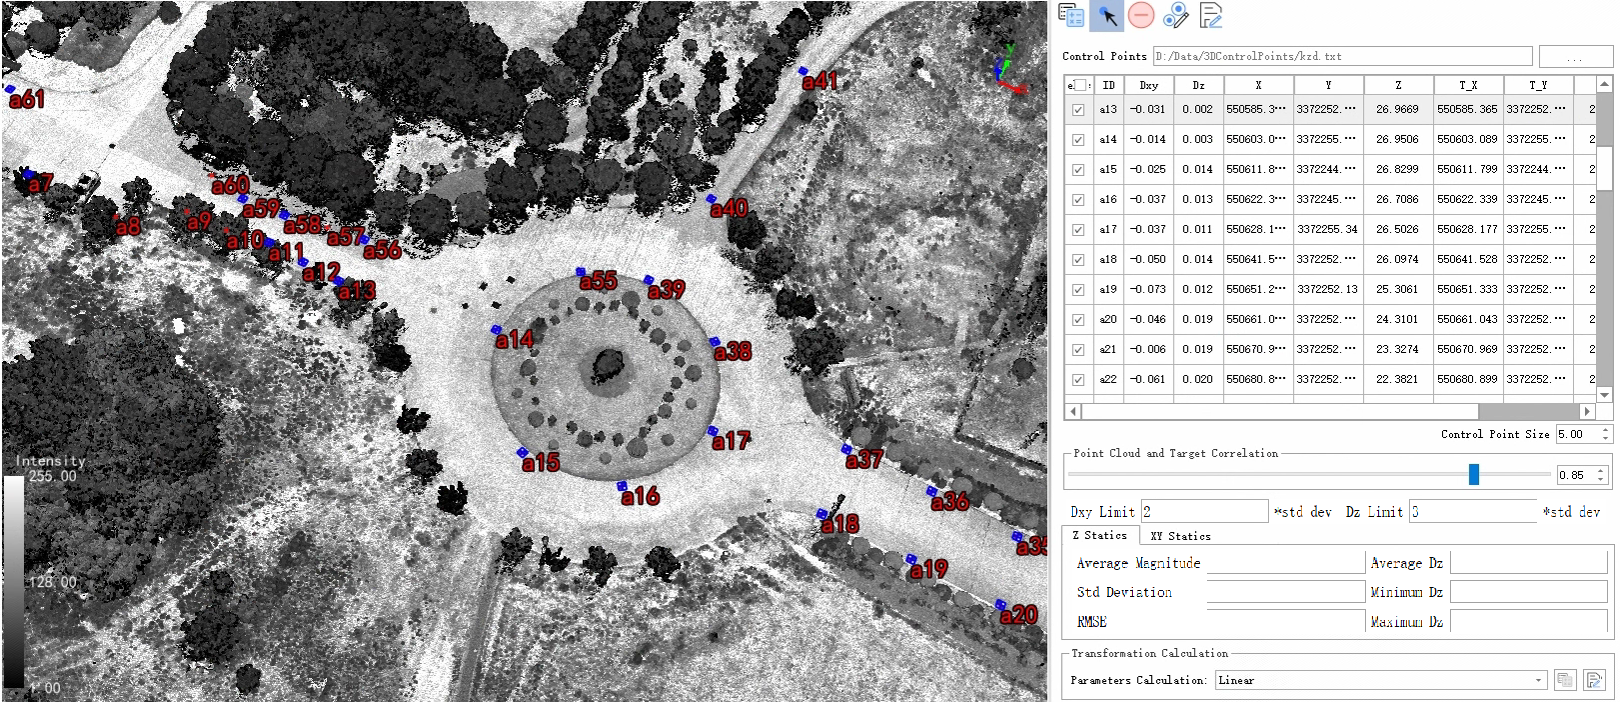
Export: The default control point content includes X, Y, Z, T_X, T_Y, T_Z, and Dz. In the pop-up interface, select optional fields such as Dxy, target type, and statistical information, including Z and XY statistics.
Automatically Identify Control Point Targets: After importing control points, use the intensity of the point cloud to automatically identify and precisely locate the closest target center to the control point. If the identified target is within the error range, it will be marked as ![]() . If the error is large, it will be marked as
. If the error is large, it will be marked as ![]() . If no target is recognized, the status will show as
. If no target is recognized, the status will show as ![]() .
.
Manually Select Target: Select the target. If the target is not identified automatically, you can adjust the point cloud-target correlation parameters and manually select the target center in the viewer. If the distance from all control points exceeds 1m, it will be considered invalid.
Draw Point: This function is suitable for cases like zebra crossings or building corners where targets cannot be set. You can select laser point cloud points as control points. The corresponding control point will be found in the list, and if the distance from all control points exceeds 1m, it will be considered invalid.
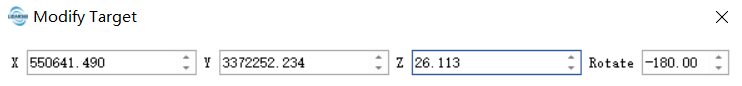
Manually Adjust Control Point Position: Modify the position of the target in the table. You can fine-tune the target's coordinates in the pop-up interface.
Delete: Delete the selected target in the table if it has a large error.
Parameter Settings
- Correlation Coefficient (default "0.85"): The correlation coefficient threshold for template matching. Targets with a correlation greater than this value will be automatically recognized. A higher value increases accuracy but may lead to recognition failure.
- Dz Limit (default "3"): This sets the tolerance for Dz. If the difference is outside this range, it will be highlighted in red to detect large elevation differences between the LiDAR point cloud and control points. Maximum tolerance = mean elevation difference + Dz limit × RMSE; minimum tolerance = mean elevation difference - Dz limit × RMSE.
- Dxy Limit (default "3"): This sets the tolerance for Dxy. If the difference is outside this range, it will be highlighted in red to detect large horizontal differences between the LiDAR point cloud and control points. Maximum tolerance = mean horizontal difference + Dxy limit × RMSE; minimum tolerance = mean horizontal difference - Dxy limit × RMSE.
Transformation Relationship Saving
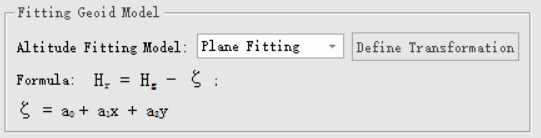
The elevation check method provides four calculation methods for Geoid Model Computation: plane fitting, polynomial curve fitting, quadratic surface fitting, cubic surface fitting, and linear transformation. Based on this, the XYZ check method offers various transformation relationship calculation functions, including four-parameter solution, seven-parameter solution, and 3D affine transformation. The linear transformation is calculated based on the positions of the recognized target and control points, which provides the delta X, delta Y, and delta Z.
Function Description: Calculate the transformation relationship.
Function Description: Save the transformation relationship.
Refer to Create Transformation Relationships.