Functions
Point Cloud-based Distress Detection
Function Description: Based on geometric feature analysis of high-precision single-line laser point clouds, detects road distress areas. Supports 7 distress types: Rutting, Depression, Potholes, Bump, Swell, Corrugation, Shoving.
Operation Steps
- Click the Point Cloud-based Distress Detection button to open the settings dialog
- Select a lane line as the road line and set related parameters
- Click OK to execute distress detection
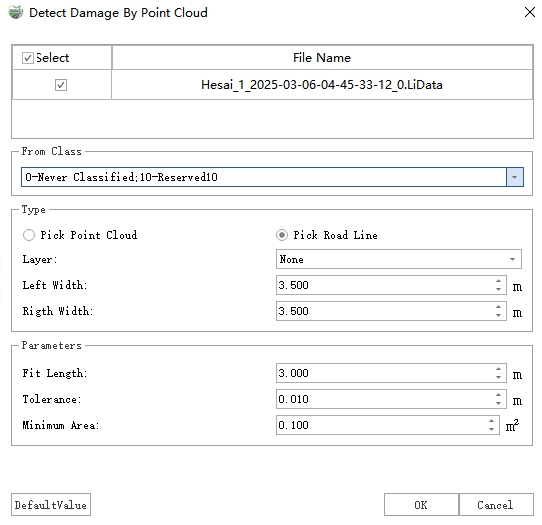
Point Cloud-based Distress Detection
Output Results
- Vector Polygons: Stored in the "Distress" layer, recording each distress's type, severity level, area, length, width, height, and other information
- Point Cloud Additional Attributes: The height value of each distress point is written to the "DistressHeight" attribute; negative values indicate depressions, positive values indicate protrusions
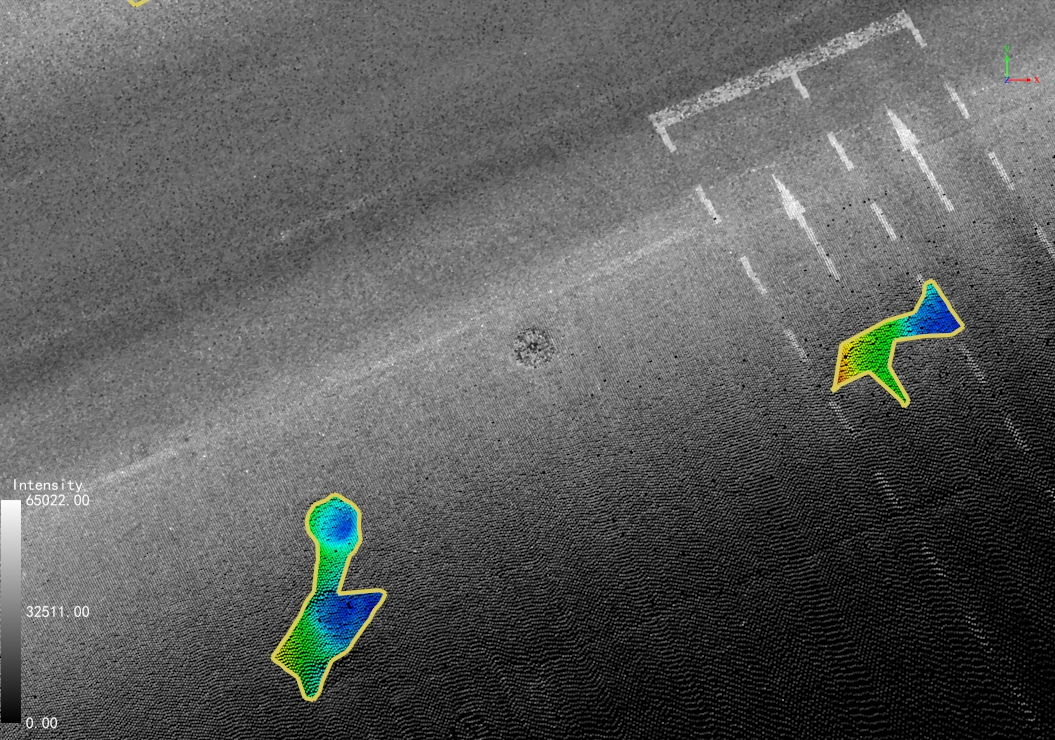
Road Distress Rendering
Parameter Settings
| Parameter | Description |
|---|---|
| Point Cloud File | Select point cloud files for detection |
| Source Class | If already classified, select "Ground Points"; otherwise select all classes (recommended to classify first) |
| Road Line | Select lane lines to define lane boundaries |
| Lane Width | Single lane width |
| Left Lane Count | Number of lanes on the left side of the road line |
| Right Lane Count | Number of lanes on the right side of the road line |
| Tolerance | Depth/height threshold; points exceeding this value are considered distress |
| Minimum Area | Area threshold; filter out distress areas smaller than this value |
Image-based Distress Detection
Function Description: Performs deep learning detection on images and maps results back to 3D space. Supports 6 distress types: Transverse Cracks, Longitudinal Cracks, Alligator Cracks, Potholes, Patching, Raveling.
Operation Steps
- Click the Image-based Distress Detection button to open the settings dialog
- Set detection type, model, camera and other parameters
- Click Detect to execute distress detection
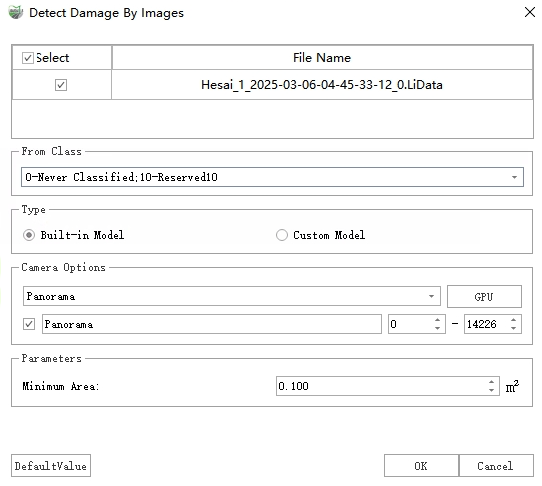
Image-based Distress Detection
Output Results
- Vector Polygons: Stored in the "Distress" layer, recording distress type, severity level, area, and other information
- Point Cloud Additional Attributes: Distress point height values written to "DistressHeight" attribute
Severity Level Classification (Longitudinal Cracks):
| Level | Crack Width |
|---|---|
| Low | < 10mm |
| Medium | 10mm ~ 75mm |
| High | ≥ 75mm |
Parameter Settings
| Parameter | Description |
|---|---|
| Point Cloud File | Select point cloud files for detection |
| Source Class | If already classified, select "Ground Points"; otherwise select all classes |
| Type | Built-in model (software) or custom model (JSON result file) |
| Camera Options | Select panoramic or planar camera; can be precisely controlled by ID |
| Maximum Distance to Image | Filter out distress areas that are too far (larger back-projection error) |
| Minimum Area | Filter out distress areas with area too small |
| Detection Type | Check the distress types to detect |
Distress Verification
Function Description: Performs manual verification on "Image-based Distress Detection" results, supporting delete, edit, and create operations.
Operation Steps
- Click the Distress Verification button and set the maximum confidence parameter
- Use "Previous"/"Next" to browse distresses pending verification
- Use verification, delete, edit, create and other functions to process distresses
Verification Operations
| Operation | Description |
|---|---|
| Previous | Jump to the previous distress with confidence below threshold and not verified |
| Next | Jump to the next distress with confidence below threshold and not verified |
| Verify | After confirming the distress is correct, automatically jump to the next one |
| Delete | Delete current distress and automatically jump |
| Edit | Modify current distress type and severity level |
| Create | Manually draw distress polygons |
| Exit | Exit verification function |
During automatic jump, all three views (3D, Panoramic, Planar) synchronize and jump together.
Create Distress
- Select distress type and severity level
- Click in 3D/Panoramic/Planar view to determine polygon vertices
- Double-click to close the polygon
Results are stored in the "Distress" layer, with length, width, and area properties automatically calculated.
Parameter Settings
- Maximum Confidence: Set the confidence threshold; only verify distresses below this value
Sample Unit Generator
Function Description: Sample units are the minimum unit for PCI calculation, used to define the pavement area and ensure that distresses outside the pavement do not participate in PCI calculation which would cause result deviation. Results are generated in the "Sample Unit" layer.
Operation Steps
- Click the Sample Unit Generator button to open the settings dialog
- Select generation mode (Automatic Mode or Fixed Width Mode)
- Set corresponding parameters, click OK to generate sample units
Generation Modes
| Mode | Description |
|---|---|
| Automatic Mode | Based on trajectory data, automatically detect curb positions to generate sample units |
| Fixed Width Mode | Based on lane line data, generate sample units according to set width and lane count |
Parameter Settings
Automatic Mode
| Parameter | Description |
|---|---|
| Source Class | Point class for curb detection |
| Min Lane Width | Curb lateral distance from trajectory point ≥ 0.5×Min Lane Width |
| Max Lane Width | Curb lateral distance from trajectory point ≤ 1.5×Max Lane Width |
| Sample Unit Area | Standard area for unit segmentation |
Fixed Width Mode
| Parameter | Description |
|---|---|
| Pick | When unchecked, use all vector lines in the "Lane Line" layer. When checked, manually select vector lines |
| Clear | Clear selected vector lines |
| Lane Width | Standard lane width |
| Left Lane Number | Number of lanes on the left side of the lane line |
| Right Lane Number | Number of lanes on the right side of the lane line |
| Sample Unit Area | Standard area for unit segmentation |
Round-trip trajectories are automatically deduplicated.
Sample Unit Editor
Function Description: Edit sample units generated in automatic mode to correct algorithm deviations.
Operation Steps
- Click the Sample Unit Editor button to enter edit mode
- Delete: Click to delete target sample unit
- Create: Draw polygons on the pavement area to complete sample unit creation
Precautions
- It is recommended to confirm the accuracy of sample units before editing to avoid affecting PCI calculation results
PCI
Function Description: According to ASTM D6433-07 standard, calculate sample unit PCI using "Distress" layer data. Associate with trajectory or Road Center Line to obtain section PCI. Results are stored in the "PCI Section" layer as vector points.
Operation Steps
- After distress detection and verification are complete, click the PCI button to open the settings dialog
- Select data source and road line vector, set parameters
- Click OK to execute PCI calculation
Parameter Settings
| Parameter | Description |
|---|---|
| Data Source | Trajectory (trajectory data in the project) or Road Center Line (manually select layer) |
| Severity Level Threshold | Define distress type severity level thresholds (default: ASTM D6433-07, see PCI for details) |
Only updates severity levels for the 7 listed types of distress; manually specified distress levels are not updated.
PCI Calculation Process
Based on ASTM D6433-07 standard:
- Divide Sample Units: Divide the target area by set area (default 225㎡)
- Count Distresses: Count total quantity by type and severity level, divided into three categories:
- Count category: Potholes
- Length category: Bumps, Edge Cracks, Reflection Cracks, Lane/Shoulder Drop-off, Longitudinal Cracks, Transverse Cracks
- Area category: Alligator Cracks, Bleeding, Block Cracks, Corrugations, Depressions, Patches, Polished Aggregate, Railroad Crossings, Rutting, Shoving, Slippage Cracks, Swells, Weathering/Raveling
- Calculate Percentage Density: Quantity ÷ Sample Unit Area × 100
- Query Deduction Curve: Obtain individual deduction DV
- Determine CDV: If only 0 or 1 deduction item > 2.0, then CDV is the sum of DVs; otherwise calculate as follows:
- 5.1 Sort DVs in descending order
- 5.2 Calculate allowable deduction items m = 1 + (9/98)×(100-HDV), where HDV is the maximum DV
- 5.3 Calculate TDV for the first m items, count items > 2.0 as q, look up CDV from table
- 5.4 Set the last item > 2.0 in the m-th item to 0, recalculate CDV
- 5.5 Iterate until only one item > 2.0 remains, take the maximum CDV
- Calculate PCI: PCI = 100 - CDV
- Generate Section PCI: Associate with trajectory or Road Center Line; results stored in "PCI Section" layer
Export Report
Function Description: Generate reports based on "Distress" layer and "PCI Section" layer data.
Operation Steps
- Click the Export Report button and select target road line
- Set export path, click OK to export report
Report Content
1. Summary
One road line is one route; summarize selected routes.
Route List
| Field | Description |
|---|---|
| Route | Route number, unique in the selected road line set |
| Section PCI Count | Number of PCI sections in current route |
| Route PCI | Area-weighted average of all PCI sections |
| Average Grade | Grade corresponding to PCI value |
| Total Fill Volume | Sum of fill volumes of all distresses in the route |
| Total Cut Volume | Sum of cut volumes of all distresses in the route |
Only point cloud-based distress detection automatically calculates fill and cut volumes; distresses obtained by other methods have fill and cut volumes of 0.
2. Route Details
Provide detailed distress distribution information in route order.
Section PCI Information: From "PCI Section" layer, containing association information between PCI sections and trajectory or Road Center Line.
PCI Section List
| Field | Description |
|---|---|
| Number | Auto-numbering, starting from one end of the route, starting number is 1 |
| CDV (Corrected Deduction Value) | CDV of current PCI section |
| PCI | Current PCI section, PCI = 100 - CDV |
| Fill Volume | Sum of fill volumes of all distresses in current PCI section |
| Cut Volume | Sum of cut volumes of all distresses in current PCI section |
| Area | Current PCI section area |
Distress Severity Level Statistics
| Field | Description |
|---|---|
| PCI Section | PCI section number |
| Type (Severity) | Distress type + severity level |
| Quantity | Sum of quantities for current distress type and severity level (see PCI for details) |
| Density | Quantity ÷ Current PCI section area |
| DV (Deduction Value) | Deduction value for current distress type and severity level (see PCI for details) |
Distress List
| Field | Description |
|---|---|
| PCI Section | PCI section number |
| Distress Type | Distress type |
| Severity Level | Severity level (see PCI) |
| Location | XYZ coordinates of distress |
| Affected Area | Area of distress vector polygon |
| Fill Volume | Fill volume of distress |
| Cut Volume | Cut volume of distress |