Subscribe

3D Laser Scanning Empowers Geological Disaster Investigation Applications

-- 29 Feb 2024 --

Hidden Danger Points Of Geological Disasters are Many and Wide

Geological disaster prevention and control work is directly related to the safety of people's lives and property. However, geological disaster hazard points are often located in many areas and are located at high altitudes and covered with plants. It is difficult for traditional manual surveys to find these hidden hazard points in time. How to break through the limitations of traditional manual surveys and troubleshooting, build a sky-air-ground integrated multi-source three-dimensional observation system based on space-borne platforms, aviation platforms, and ground platforms, timely discover hidden danger points of geological disasters, and make predictions and early warnings for hidden danger points, Improving the ability to prevent and control geological disasters is an urgent problem that needs to be solved.


In the detailed investigation stage of earthquake risk areas, technologies such as optical remote sensing technology, drone low-altitude aerial photography, and airborne lidar are mainly used. Among them, optical remote sensing technology and drone low-altitude aerial photography cannot obtain the real surface information under the vegetation, and The geometric accuracy of the data is affected by weather factors and sensor types, there are also certain limitations in the early identification of geological hazards. As an emerging measurement method, airborne laser surveying technology has a unique " multi-echo " technology that can penetrate gaps in vegetation to reach the surface, truly depict landform features, and quickly construct high-precision topography, which is beneficial to forest areas, Conduct investigation, and risk assessment research on landslides, collapses, debris flows and other local disasters in areas with dense vegetation such as mountainous areas. 


3D Laser Scanning Solution


默认文件1709275052823.png


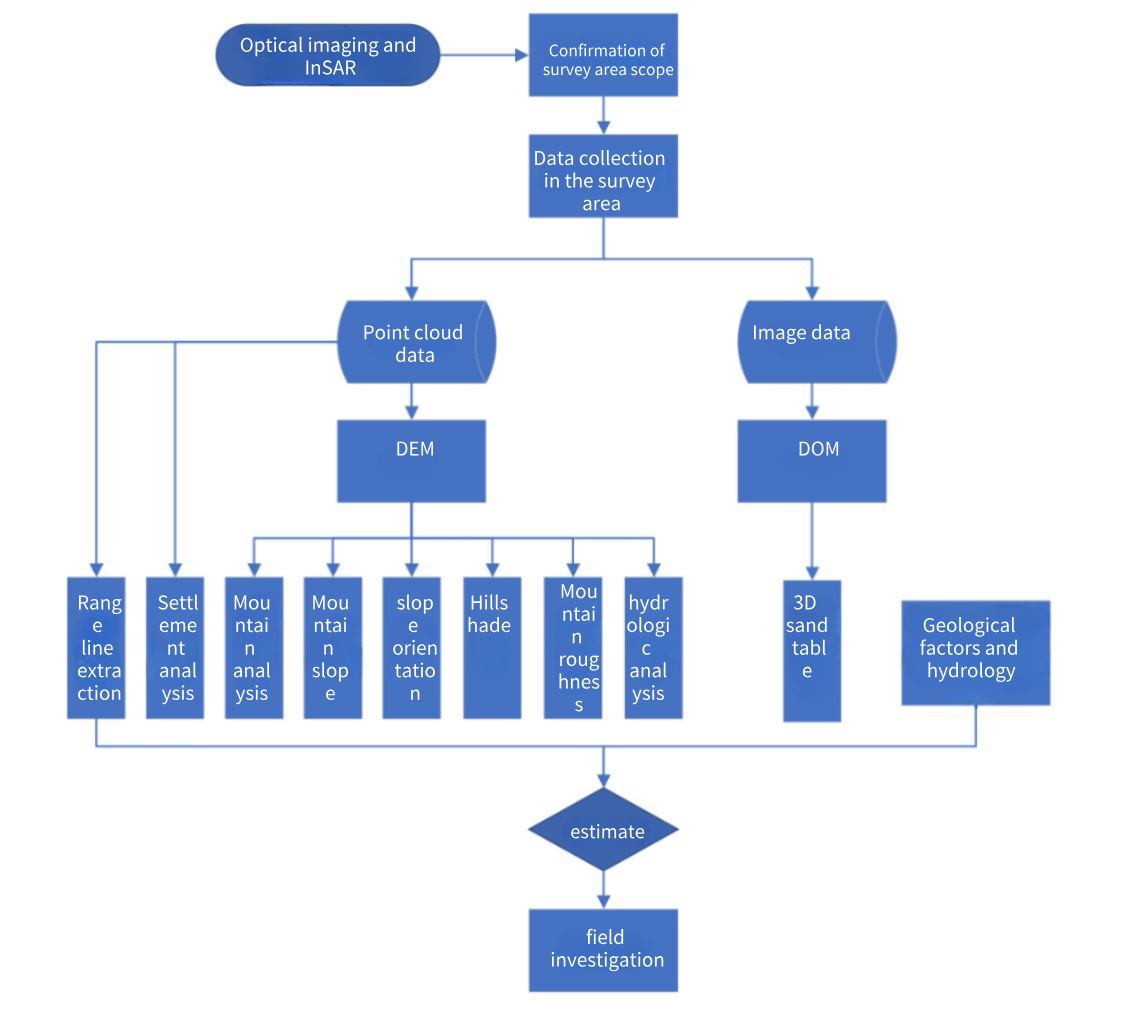
Determine the Scope of the Survey Area


Through satellite remote sensing images or InSAR data, the conditions in areas prone to earthquake disasters can be observed, and detailed investigation areas can be initially delineated.


LiAir X3C - H Data Acquisition


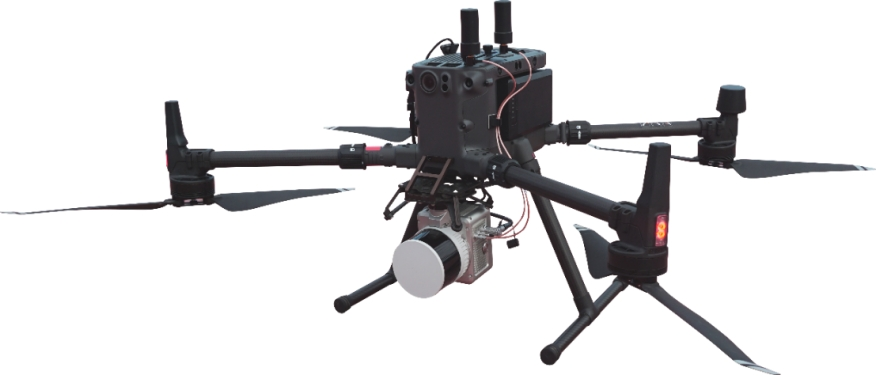
The airborne lidar system LiAir X3C -H is used to collect point cloud data of target objects. High-precision point cloud data can be obtained through LiAir X3C-H, which improves the accuracy of internal mapping and greatly improves operating efficiency. Not only It can provide reliable basic data support for the geological disaster investigation information system and geological disaster engineering management, but can also effectively guide the development of geological disaster prevention and control work.


Data results mainly include original laser point cloud data, high-resolution image data, POS data, and ground base station GNSS data of the survey.
图片3.png

图片4.png

                                                         
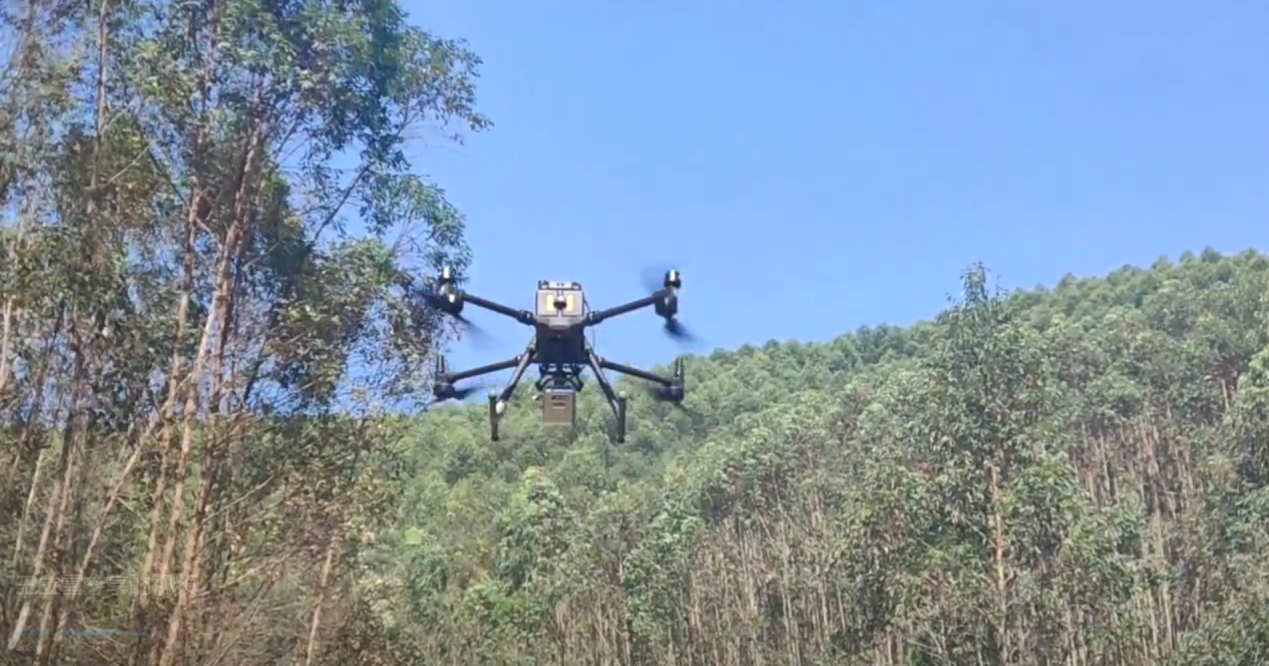
LiAir X3C-H airborne lidar system collects data in geological disaster - prone areas


Data Preprocessing

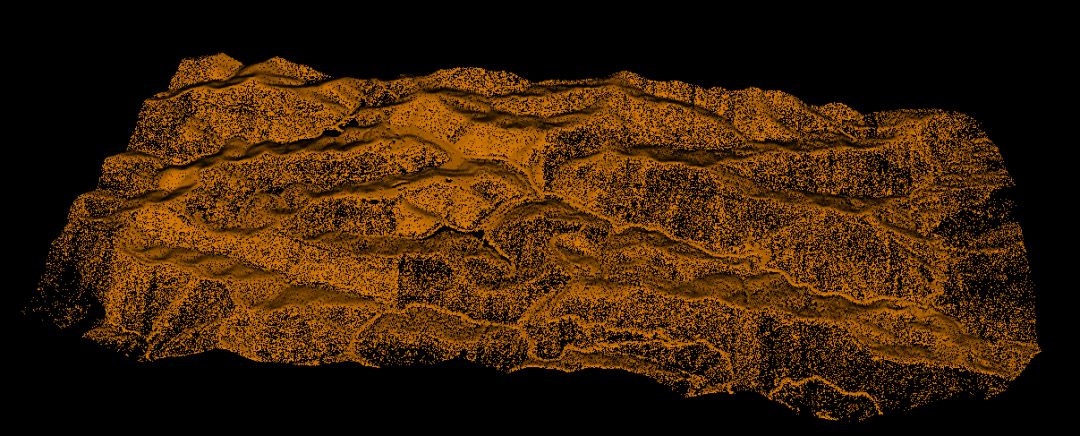
By classifying point clouds through the LiDAR360 ground point classification function, non-surface data such as vegetation can be separated to obtain accurate ground point cloud data.


图片5.png


In the investigation of earthquake disasters, DEM produced from laser point cloud data generally retains small landform information such as slopes, rocks, and steep ridges. This information is often considered to be a very important precursor characteristic of disasters, and its accuracy can directly determine the accuracy of earthquake disaster evaluation. degree of accuracy.


Through the classification and editing function of LiDAR360, the automatically classified ground point data can be inspected and finely classified and edited to ensure the accuracy of the ground point data.


Lidar 360 Terrain Data Production 

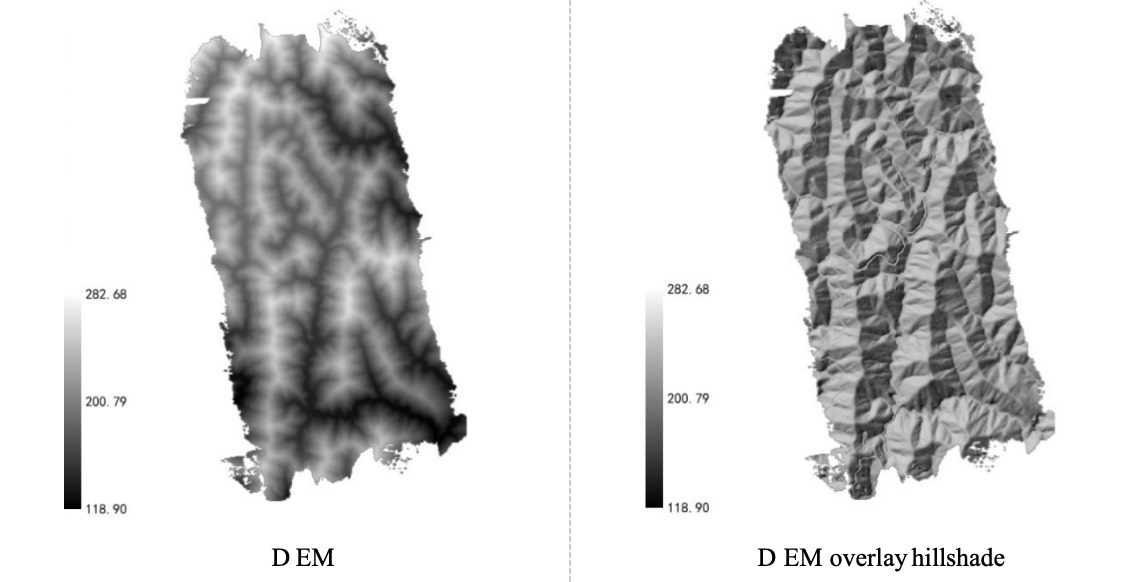
1. DEM Production

The digital elevation model DEM can be used to comprehensively identify potential geological hazards such as landslides, debris flows, and collapses.


Snipaste_2024-03-01_15-14-17.jpg

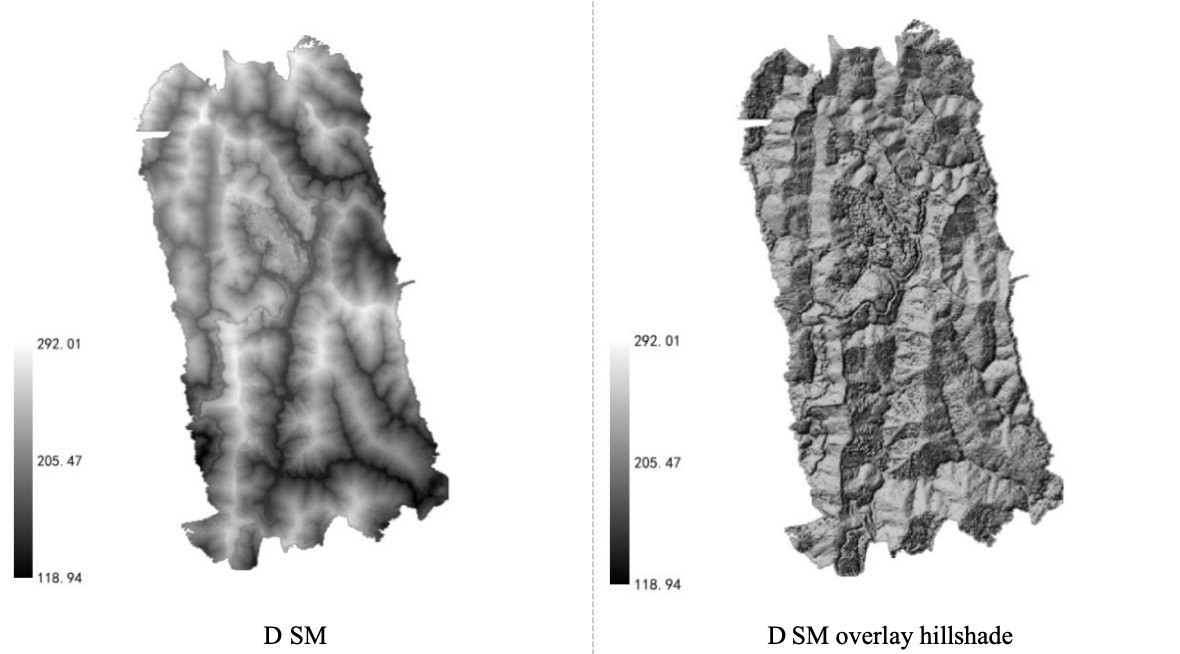
2. DSM Production

DSM results cover information on other elevations besides the ground, such as surface buildings, bridges and trees.


Snipaste_2024-03-01_15-15-43.jpg

3. DOM Production

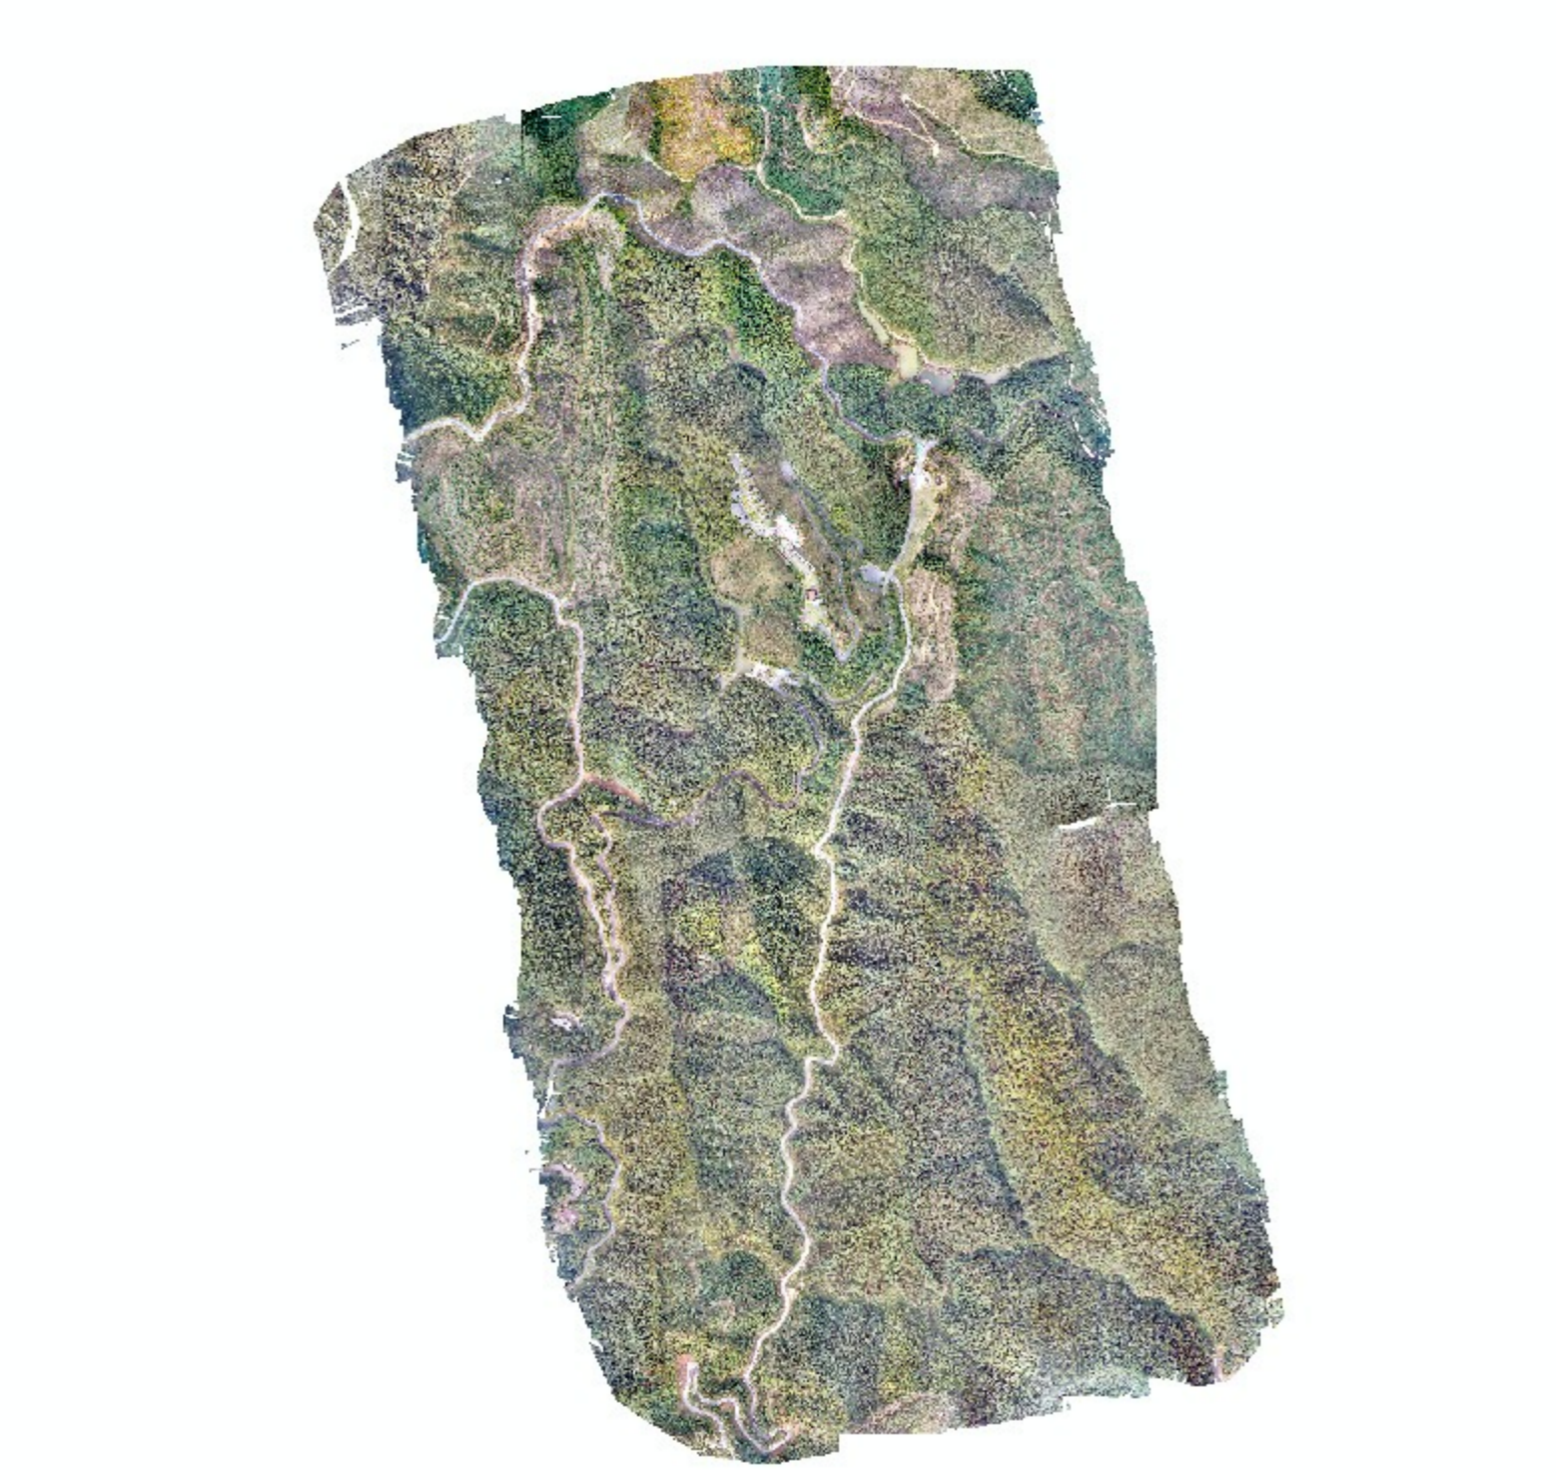
图片7.png


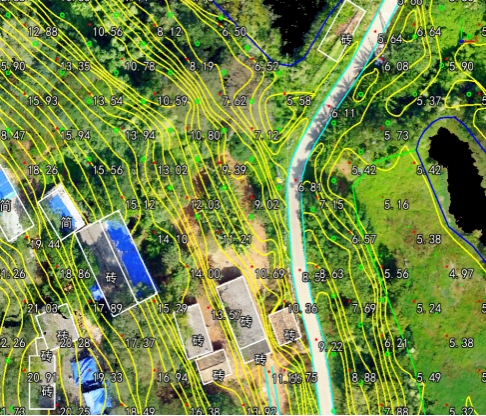
4. DLG Production

图片8.png

image.png


image.png


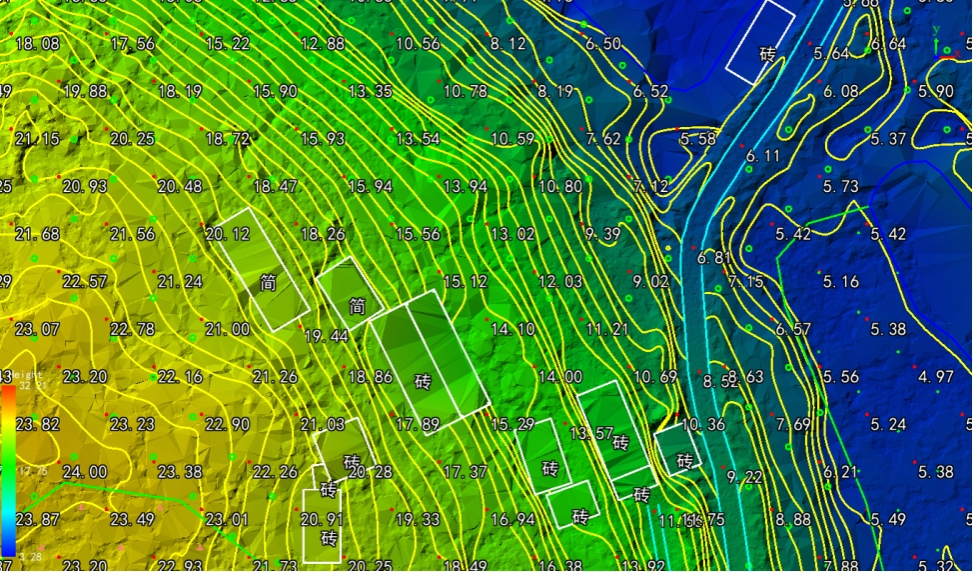
                                                                                                           Contour overlay TIN display


Point Cloud Data

Geological Morphology Analysis

1. Mountain structural plane analysis


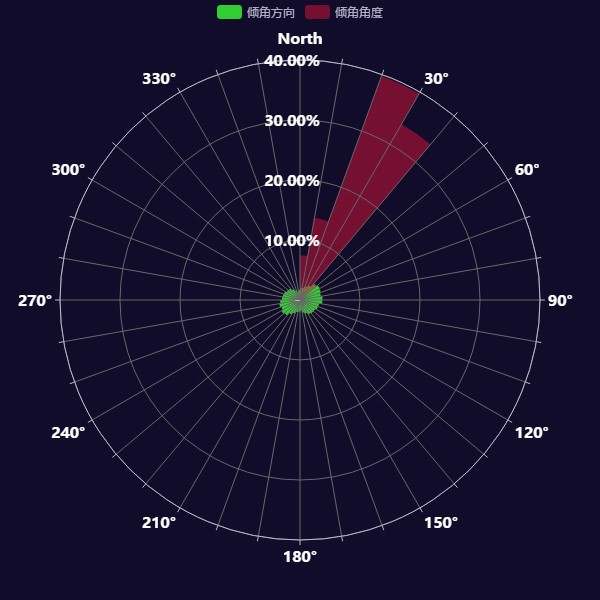
The mountain structural plane includes the mountain inclination angle and the mountain direction.

Mountain inclination can be used to monitor terrain stability and evaluate slope stability. Larger slopes may increase the risk of geological disasters such as landslides, avalanches, and collapses, causing loose soil and rocks to move, increasing the speed of rainwater runoff, and increasing the risk of surface erosion and soil erosion.


图片10.png

图片11.png

                                               
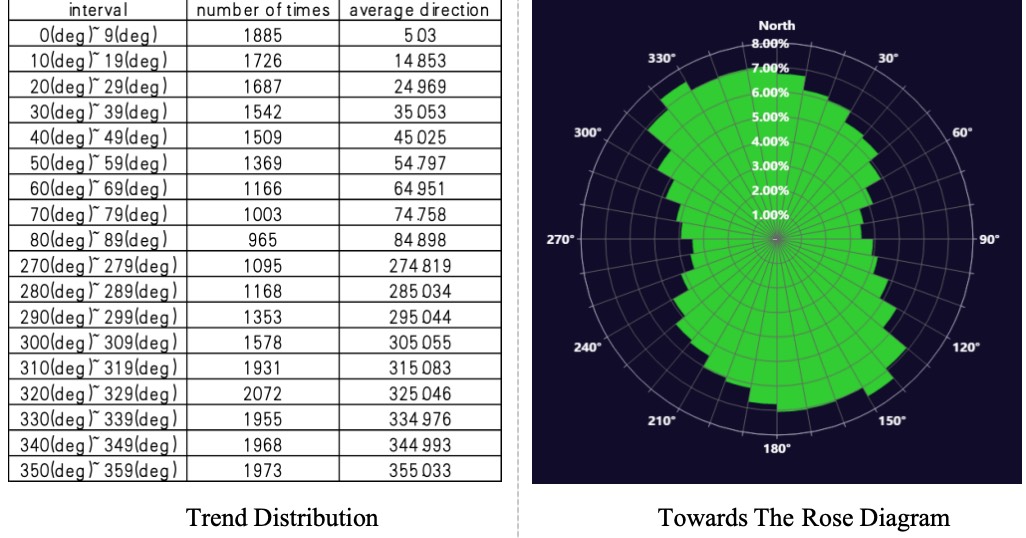
                                                                                                                        Inclination And Tendency Rose Diagram

The direction of the mountain determines the degree of sunlight exposure on different slopes, thereby affecting the local climate. This may lead to differences in vegetation distribution and soil moisture content on different slopes, which may have an impact on the stability of the mountain.


Snipaste_2024-03-01_15-29-01.jpg

2. Mountain Slope Analysis


Mountain slope refers to the angle between the mountain surface and the horizontal plane and is a parameter describing the steepness of the mountain slope. When the mountain slope is large, surface water flow and gravity are more likely to cause the slope to slide or collapse, thereby increasing the possibility of geological disasters such as landslides and debris flows.
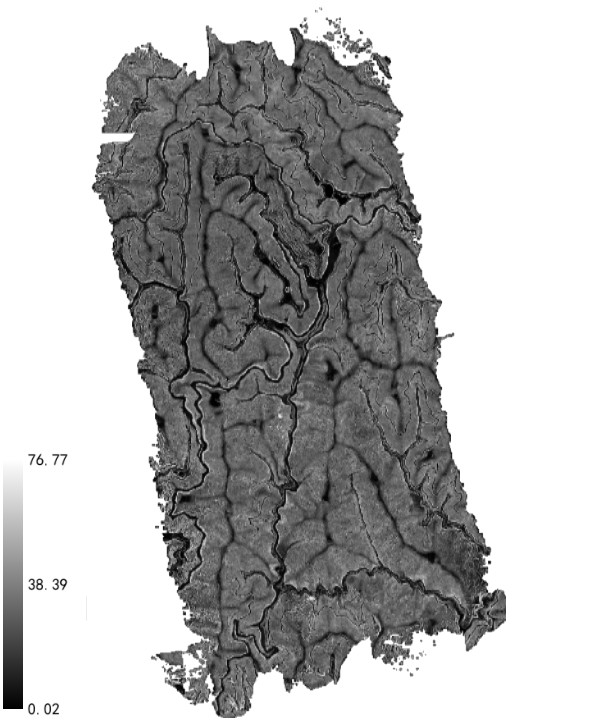
图片12.png

Slope raster image


3. Mountain Slope Aspect Analysis

Aspect refers to the direction of the terrain. Slopes with different slope directions are subject to different weathering and erosion effects, so the quality and stability of the terrain will also be different.
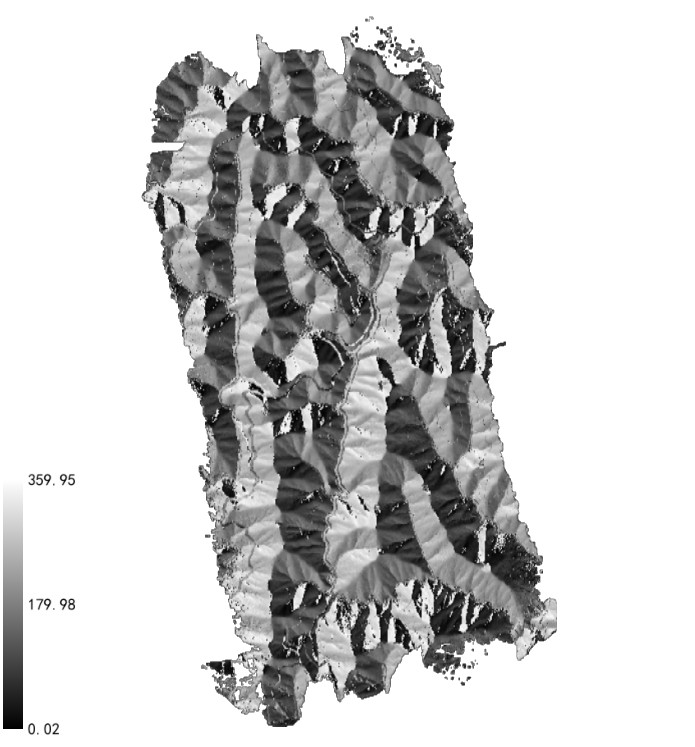

图片13.png


                        Aspect raster image


4. Hydrological Analysis


Hydrological analysis mainly investigates the direction and path of runoff. The direction of runoff on a slope directly affects the flow path of water. The concentration of water flow can lead to geological hazards, and for precipitation events, water flowing along slopes can trigger mudslides.
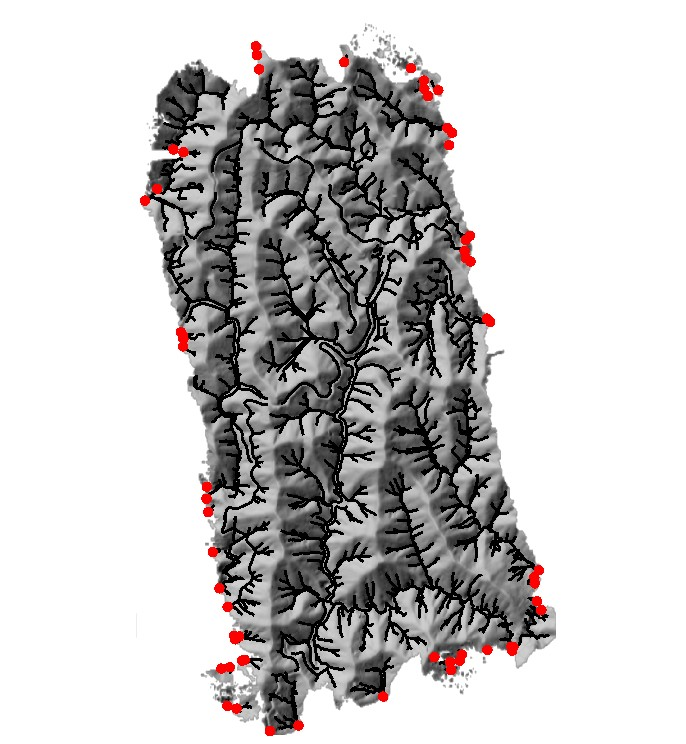


图片14.png

                                                                                                                                                               Drainage lines and water outlets


5. Mountain Shadow


Hillshade refers to the terrain shadow drawn on the map, which is used to simulate the effect of sun light on different terrains. Before a geological disaster occurs, characteristics such as the shape, size, and location of mountain shadows may change. These changes can be used as a basis for early warning and can also reflect the severity of the geological disaster.
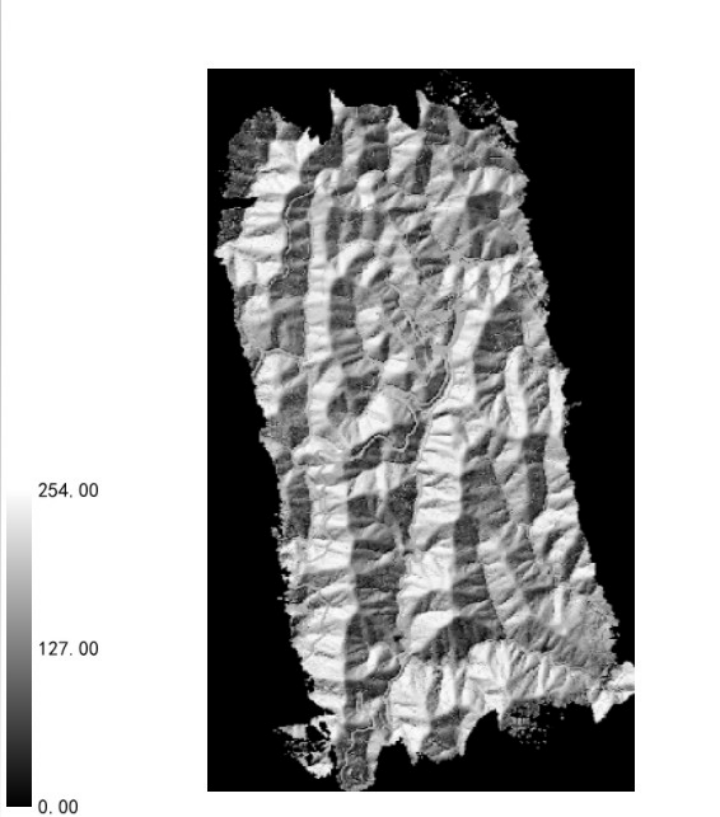


图片15.png

                                                                                                                                                 
                                                                                                                                                                                         hillshade image

6. Surface Subsidence Analysis

Surface subsidence is usually caused by factors such as falling groundwater levels, geological changes, the weight of surface buildings, improper land use, and other factors.
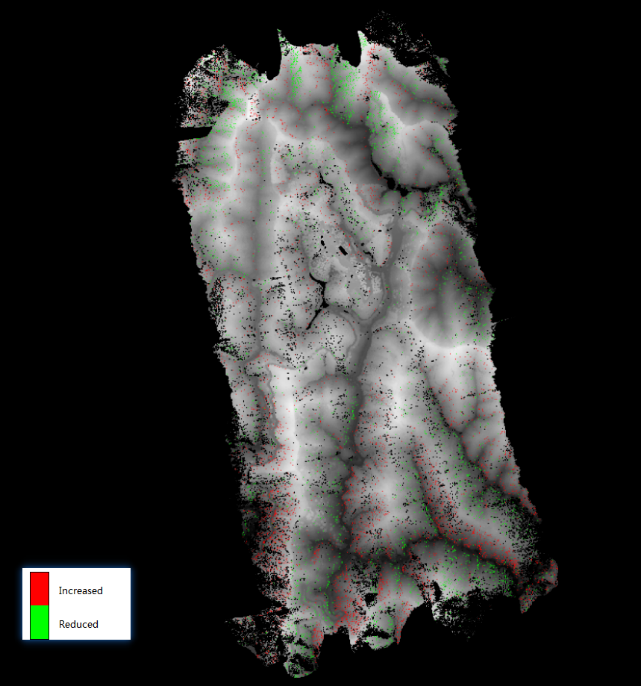
image.png


Change Monitoring Results


Image Data

Three-Dimensional Sandbox Construction


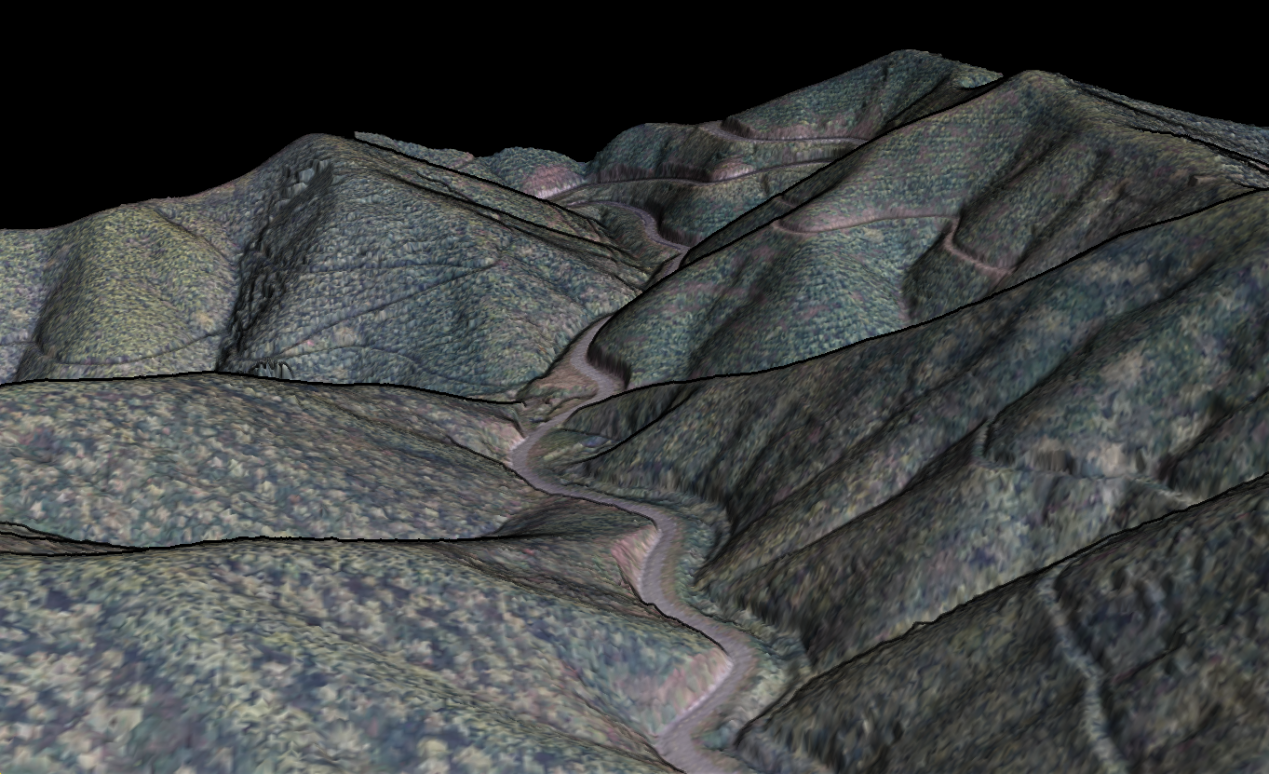
The three-dimensional sand table can simulate a three-dimensional model of a geographical area or object, intuitively express terrain fluctuations and surface characteristics, and reflect surface vegetation, water areas, and building information. By superimposing meteorological, hydrological, and other data for analysis, it can further predict and deduce geological disaster hazard points.
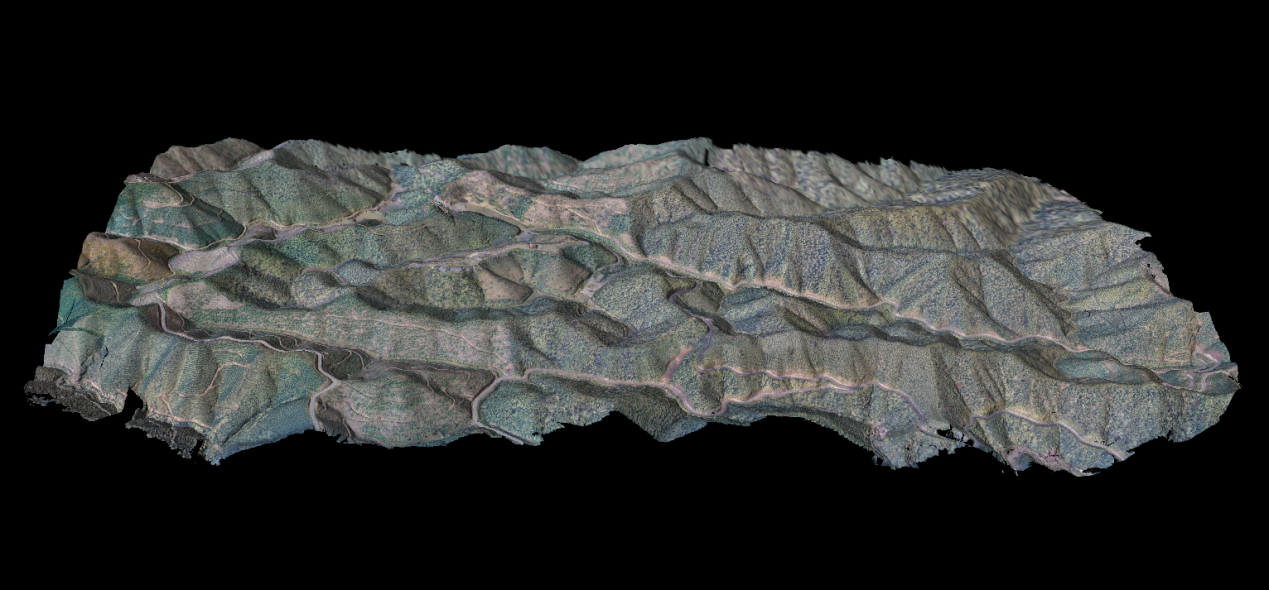


图片16.png


3D sandbox (global)

图片17.png

                                                                                    
Three-Dimensional Sand Table (Partial)


Point Cloud + Image Data

Comprehensive Assessment To Identify Hidden Danger Points


By analyzing the inclination, inclination, slope, aspect, direction, mountain shadow, etc. of the mountain topography in the survey area, as well as analyzing surface water flow and surface roughness, we can interpret areas where geological disasters may occur. Combined with the existing geological, hydrological, vegetation, and other information in the survey area, the analysis results can be comprehensively evaluated and re-interpreted, and hidden danger points of geological disasters such as landslides and debris flows can be quickly identified. Finally, through field investigation, the hidden danger points of geological disasters were determined.

Compared with traditional geological hazard measurement technology, 3D laser scanning mapping technology has the advantages of high accuracy, fast speed, high resolution, non-contact, and excellent compatibility. For difficult scenarios such as relatively large terrain height differences and many dangerous rock masses, the technical advantages of three-dimensional lasers can be used to ensure the accuracy of in-house mapping and personnel safety, reduce field time and costs, and provide reliable data for geological surveys.


Recommended Articles

HOW CAN WE HELP YOU?
Message us your questions and contact information.
We’ll get back to you right away!