Exercise 2: Using GCPs, MTPs, and Check Points
The quality and absolute accuracy of photo alignment can be improved by using Ground Control Points (GCPs). Data output qualities can also be improved in areas where matching key points were difficult for LiMapper to identify and automated methods failed to be register images correctly using Manual Tie Points (MTPs). The software also allows users to evaluate photo registrations and alignments using imported survey Check Points and generate a project quality control report.
In this exercise, we will use Control Points to improve absolute accuracy, and Check Point to evaluate accuracy. In the following text, GCPs will be used to refer to a combination of GCPs, MTPs, and Check Points.
If GCPs will be used in the project, in the one-step process above, you may uncheck Dense Cloud, Terrain, and Mosaic in Process, because only Alignment process is necessary for adding GCPs. In addition, when updating alignment after adding GCPs, the dense cloud, terrain, and orthomosaic imagery products will be removed.
Therefore, if GCPs are used in the project, the recommended workflow is: Alignment > Add GCPs > Generate Quality Report > Process Dense Cloud, Terrain, and Mosaic.
Add GCPs
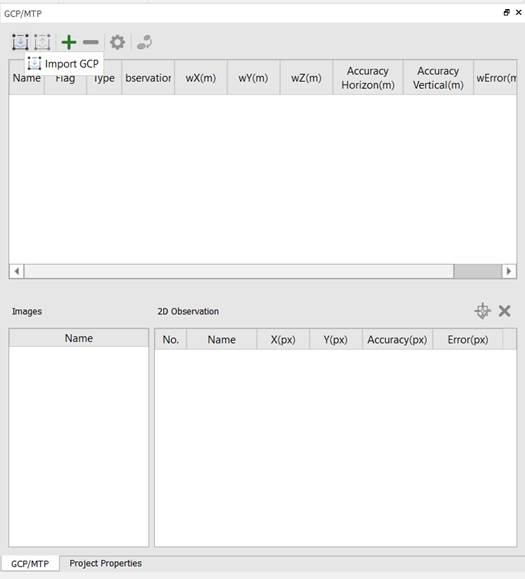
1 If GCP/MTP window does not show up in the panel on the right side, click Options on the top right > Windows > GCP/MTP.
2 Click Import GCP in the GCP/MTP window.
3 Browse to the GCPs table and click Open.
4 In GCP Editor, Edit Coordinate System of the GCPs, and skip the header lines.
5 Under Flag, mark the point as Ctrl Point (Control Point) or Check Point, based on whether the point will be used as control point or check point for accuracy evaluation.
To select multiple, use Ctrl or Shift, or Ctrl + A to select all, and change Flag for selected rows at once.
6 Click OK.
7 In GCP/MTP window, select a row of GCP, the predicted images where this selected point can be found are listed in the bottom left Images window.
Corresponding images will only be predicted if Alignment process has been run.
8 Double-click at the first image in Images window. The image will display in the map view.
9 A predicted location of the GCP is also marked on the image. The predicted location is usually near the true location of the GCP. Therefore, zoom to the predicted location and find the GCP. Click on the GCP.
10 In the 2D Observation window, click ![]() Add 2D Observation to add the marked GCP to the table.
Add 2D Observation to add the marked GCP to the table.
11 Mark at least 4 GCPs for one image.
12 Follow the same method to add 2D observations for other images.
Generate Quality Report
13 After finish adding GCPs, click Update Alignment ![]() to update alignment using GCPs.
to update alignment using GCPs.
14 In Process ribbon, click Quality Report ![]() .
.
15 In the Quality Report window, click OK to generate report for the default items. The generated result is placed in the project folder > 1_Report.