## View the Point Cloud Segmentation Results ##
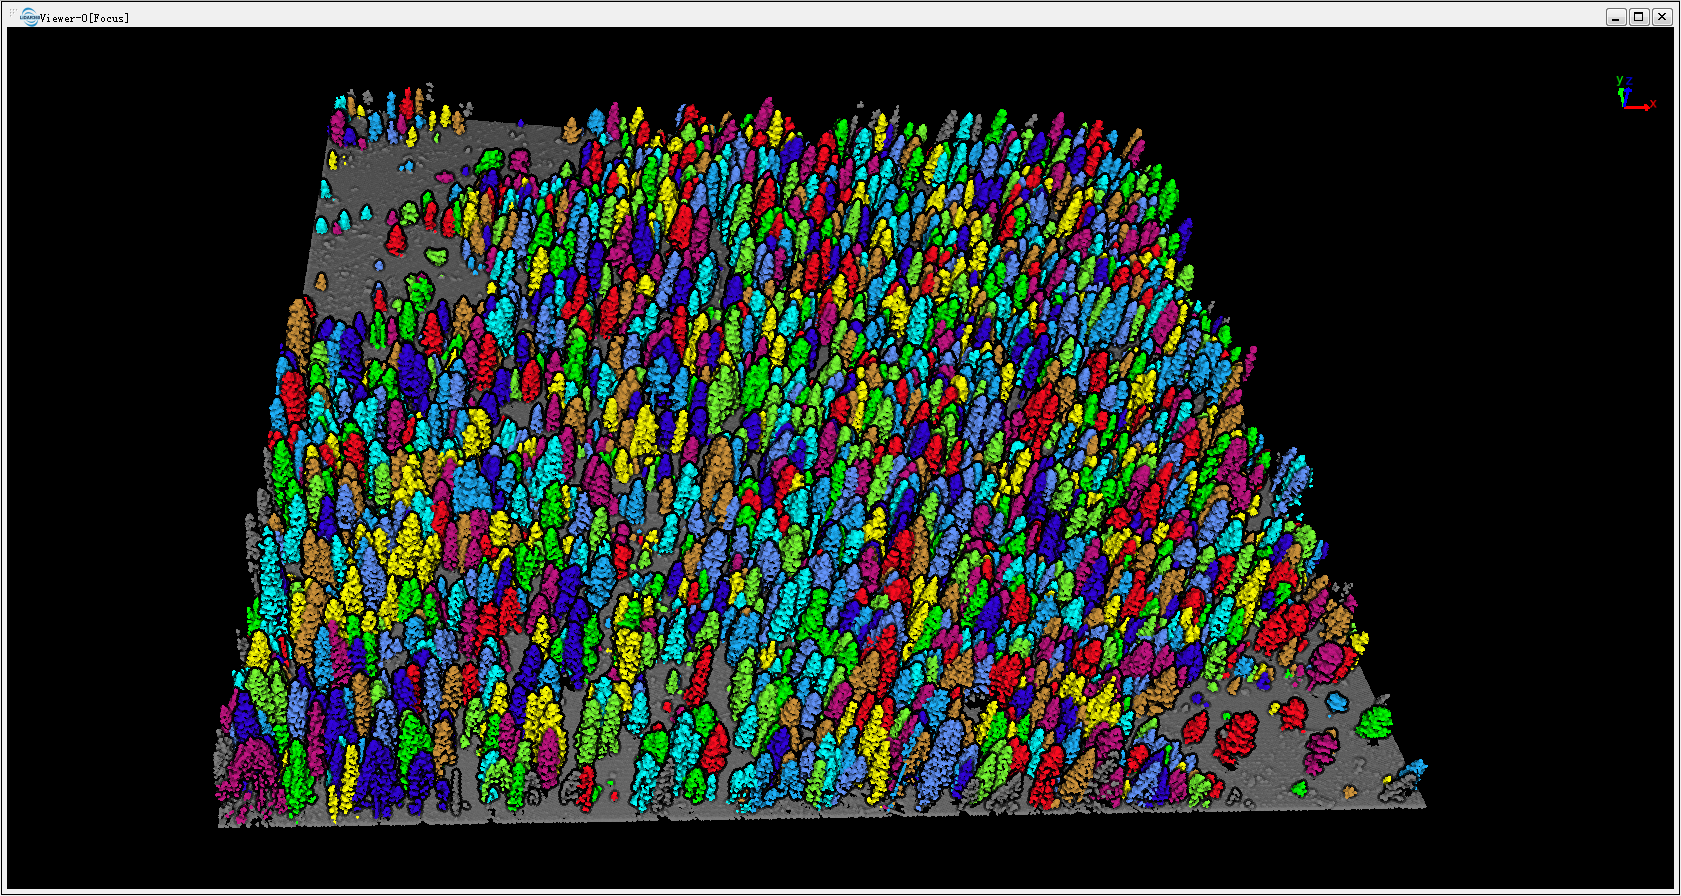
After segmenting the trees, Tree IDs are saved to each point in the point clouds used in the segmentation, the results can be viewed within a window viewer. Load the point cloud used for the tree segmentation into a 3D viewer. Ensure the viewer is active and press the Display by Tree ID button in the color tools toolbar. The following is an example of a point cloud colored by individual tree. The [ALS Editor](ALSEditor.md) tool can be used to check the single tree segmentation results. At the same time, it can be used for editing operations such as add, delete seed points etc., and segment the point cloud data based on the edited seed points.
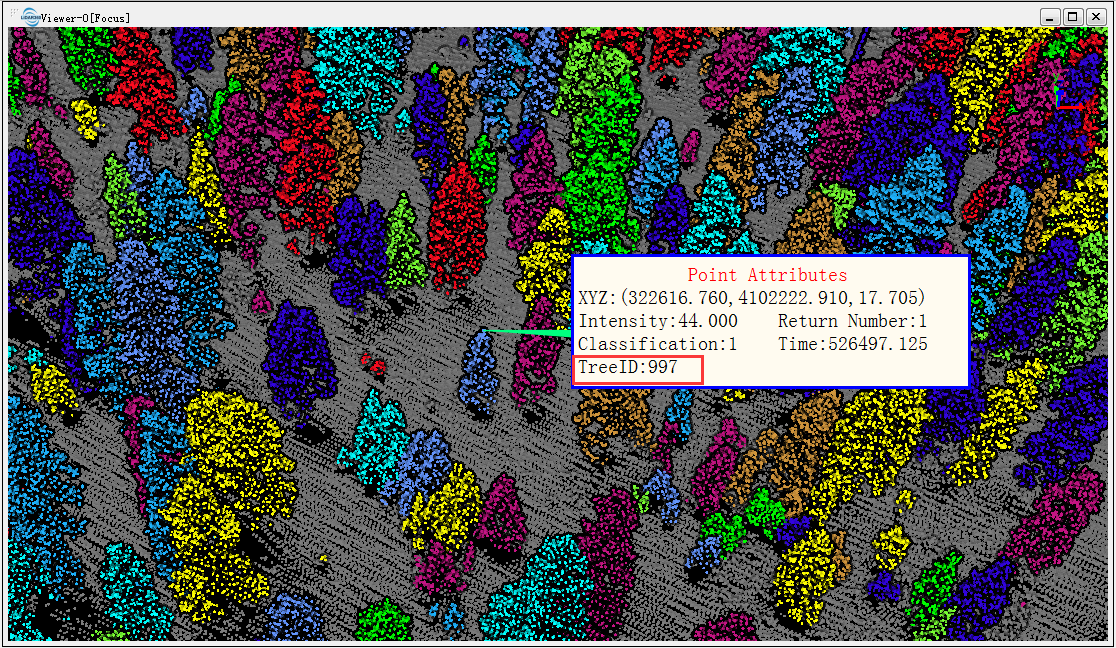
The tree ID attribute of each point can be queried by the Pick Point( )tool on the toolbar.
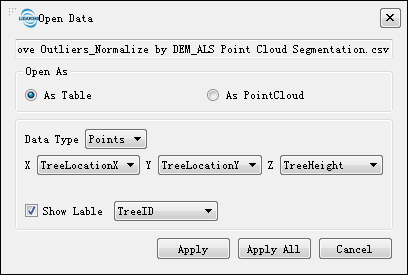
CSV file generated by segmentation can be superimposed with the point cloud, and the CSV file can be opened as a table. Select X, Y and Z as the TreeLocationX, TreeLocationY and TreeHeight respectively in the CSV file as shown below, and check the Show Label (if the label has too much text and blocking other data, affect the display effect, you can remove the data and open again, do not check the Show Label), click “Apply” to load the CSV file in the software.
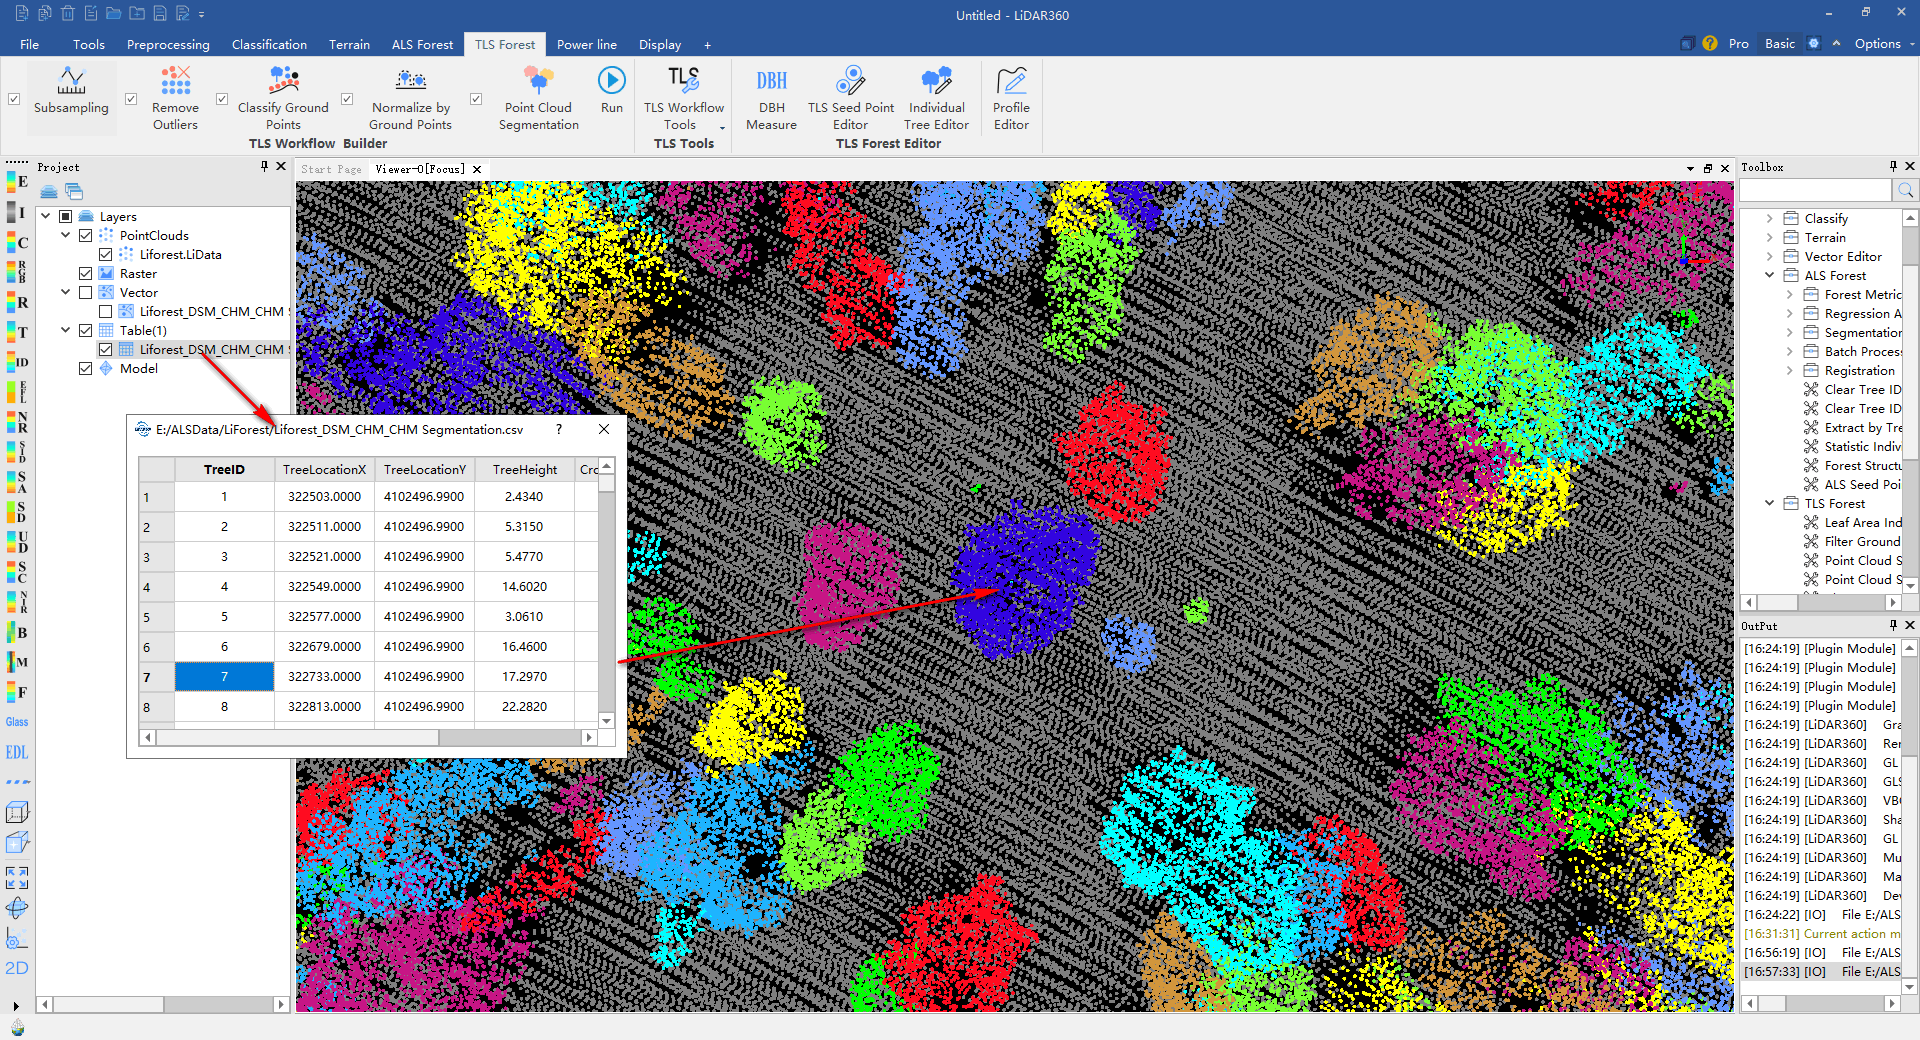
Click the right mouse button on the CSV file name, select Table Attribute, you can view the property information, double-click the left mouse button anywhere in each line, you can jump to the corresponding location.
The following figure shows the effect of superimposed display of point cloud data and CSV file. Open the attribute table of the CSV file and double-click to jump to the selected row.
)tool on the toolbar.
CSV file generated by segmentation can be superimposed with the point cloud, and the CSV file can be opened as a table. Select X, Y and Z as the TreeLocationX, TreeLocationY and TreeHeight respectively in the CSV file as shown below, and check the Show Label (if the label has too much text and blocking other data, affect the display effect, you can remove the data and open again, do not check the Show Label), click “Apply” to load the CSV file in the software.
Click the right mouse button on the CSV file name, select Table Attribute, you can view the property information, double-click the left mouse button anywhere in each line, you can jump to the corresponding location.
The following figure shows the effect of superimposed display of point cloud data and CSV file. Open the attribute table of the CSV file and double-click to jump to the selected row.